
Research · Q1 2026
Asymmetric Visibility: 70% of mid-market APAC companies do not produce enough publicly observable signal to be assessed with confidence.
The AIR APAC Mid-Market Readiness Index, Q1 2026. 510 companies. Five markets. Six sectors. The first quarterly publication of the AIR APAC research arm – measuring observable preconditions for AI adoption, not self-reported readiness.
510
Companies scored
5
Markets · AU SG MY ID TH
6
Sectors
70%
Low confidence
Mean Total Readiness Score: 17.3 / 100. Within the confident subset (153 companies): mean TRS 39.7, 33% Pacesetter.
Featured publications
Findings Report · Q1 2026
Asymmetric Visibility
The AIR APAC Mid-Market Readiness Index, Q1 2026. A 39-page institutional findings report organised around six proprietary findings. Boardroom register, evidence-led, drawn entirely from observable signals across 510 companies.
Inaugural Edition · April 2026
Bridging the AI Readiness Gap in Asia Pacific Mid-Market Enterprises
The full white paper. Methodology, signal architecture, market and sector results, the APAC Data Desert finding, and recommendations for governments, enterprises, and policy bodies.
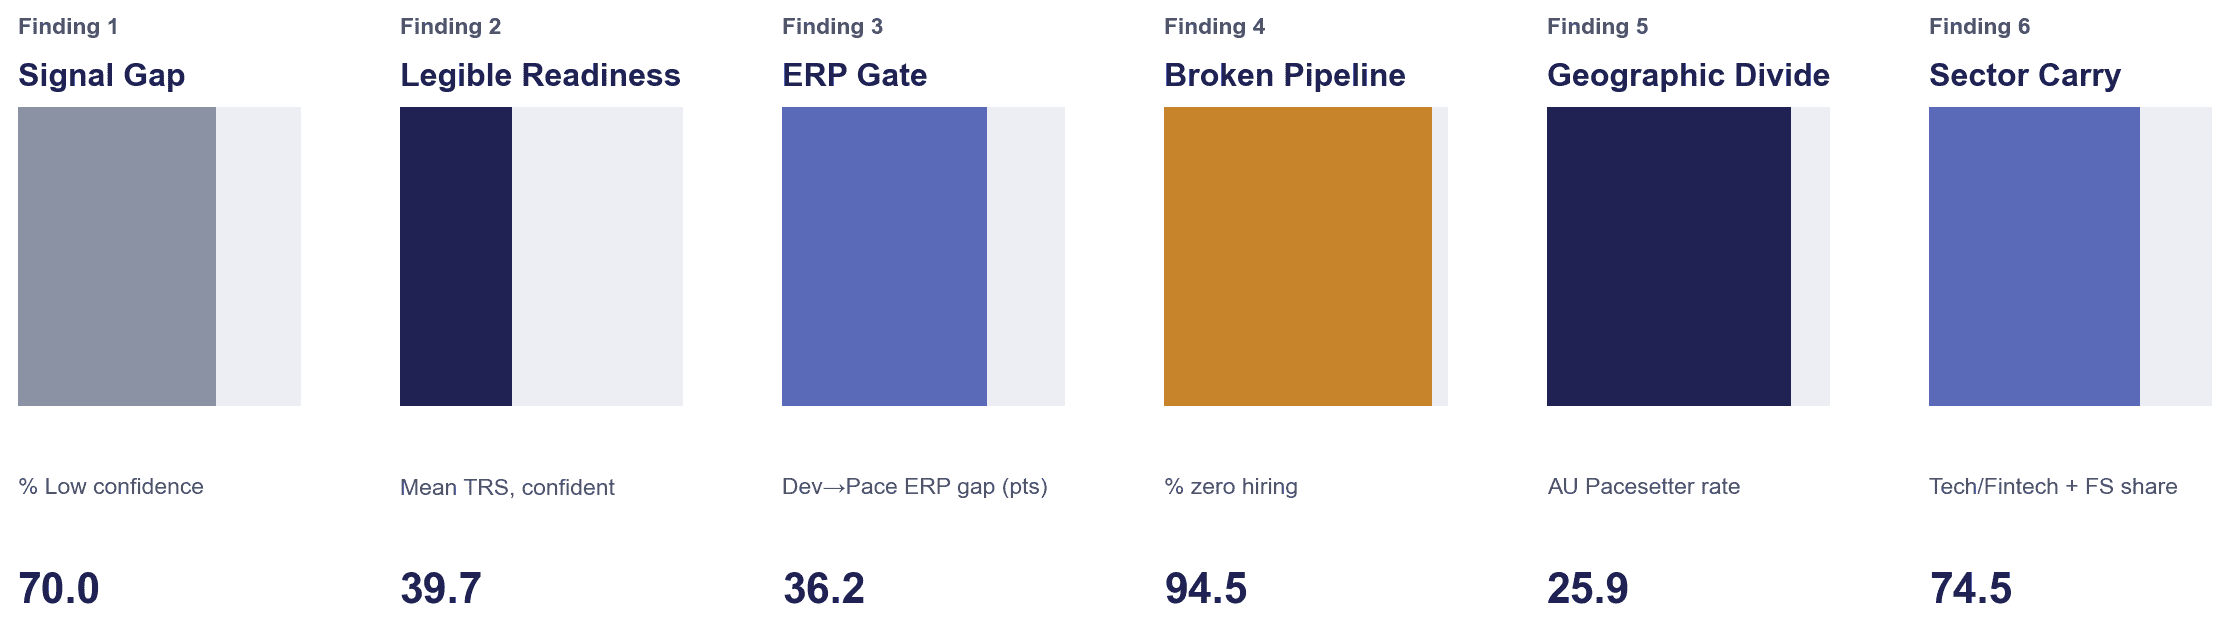
Six findings at a glance
Finding 01
The Signal Gap
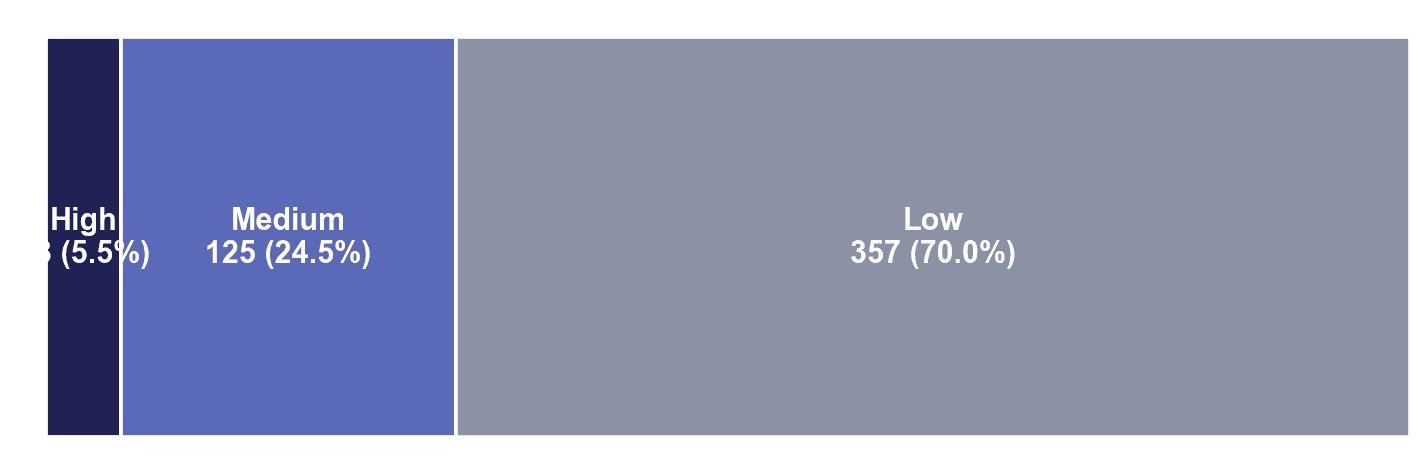
70% of mid-market APAC companies do not produce enough publicly observable signal to be assessed with confidence.
Information opacity is the first-order readiness problem. The 357 Low-confidence companies aren’t necessarily unprepared – they’re illegible. A company that doesn’t publish AI activity signals cannot be distinguished from one that is unprepared. Visibility itself is a readiness behaviour.
Finding 02
Where readiness is legible
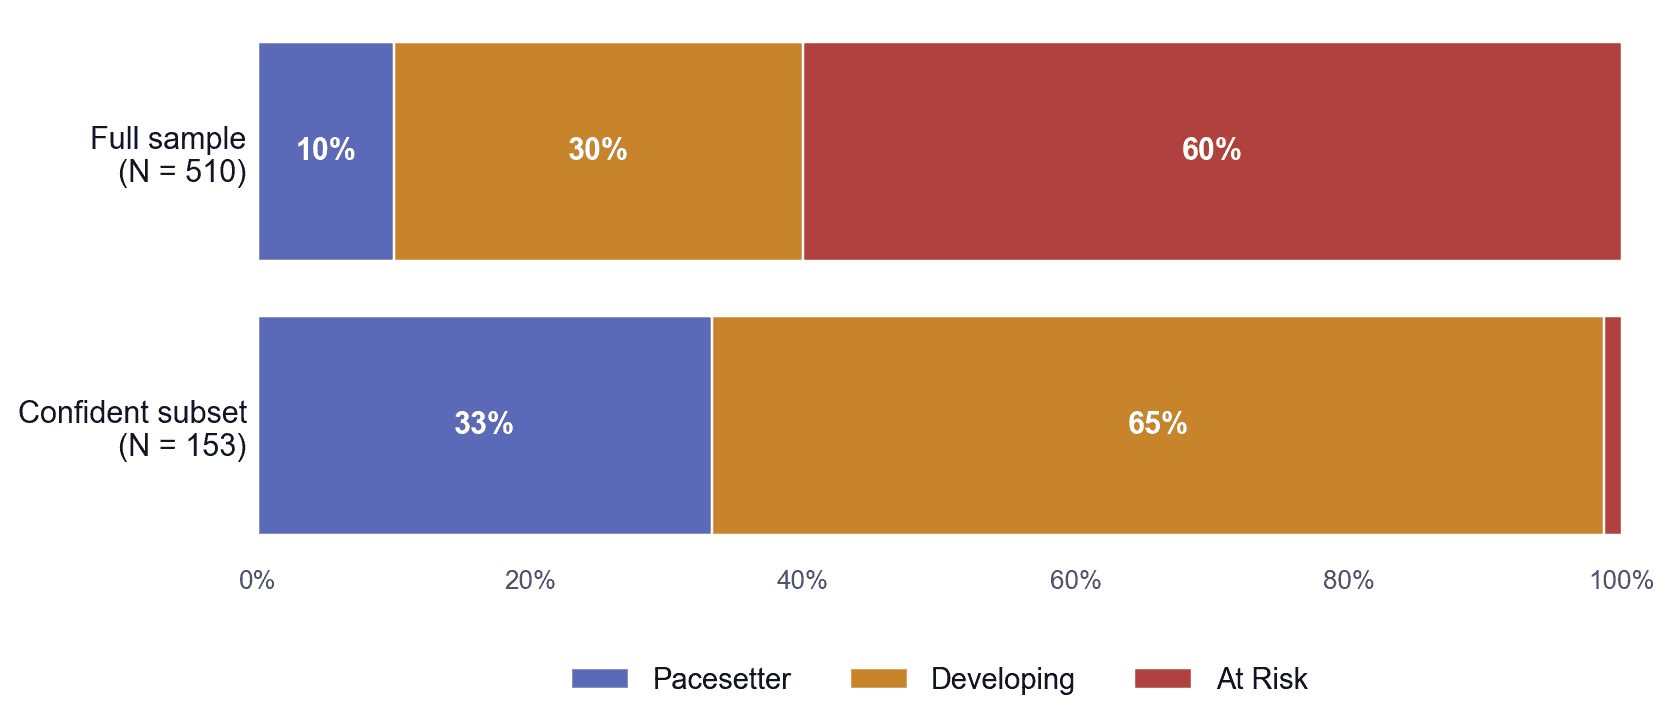
Within the 153 companies observable at Medium or High confidence: 33% Pacesetter, 65% Developing, 1% At Risk. Mean TRS 39.7, not 17.3.
The full-sample picture is dominated by low observability – 60% of companies score At Risk, but 70% of the dataset is also Low confidence. Within confident data, one in three observable companies has already crossed the Pacesetter threshold.
Finding 03
ERP is the modernization gate
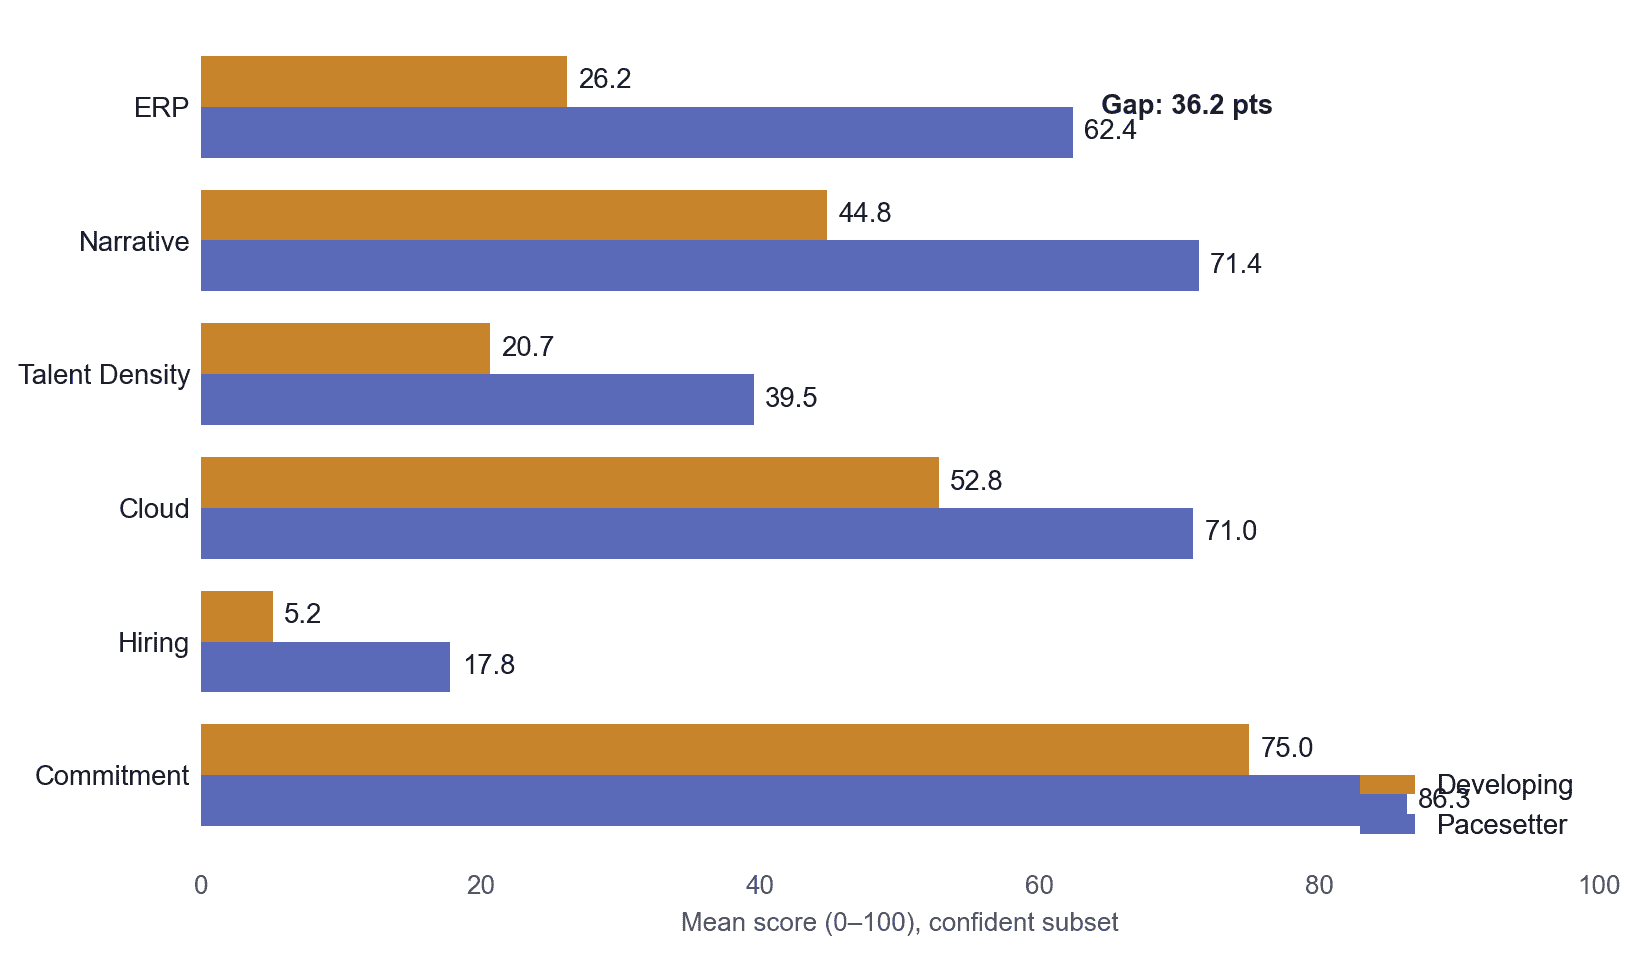
Within the confident subset, ERP score has the largest gap between Developing and Pacesetter – 36.2 points, from 26.2 to 62.4.
Infrastructure execution, not strategy narrative, is the clearest separator between tiers. Some Pacesetters do not show a modern ERP signal, but the tier-level gap is still largest on ERP. The finding is non-tautological: it’s a within-subset claim on confident data, not a restatement of how TRS is constructed.
Finding 04
The pipeline is broken at every tier
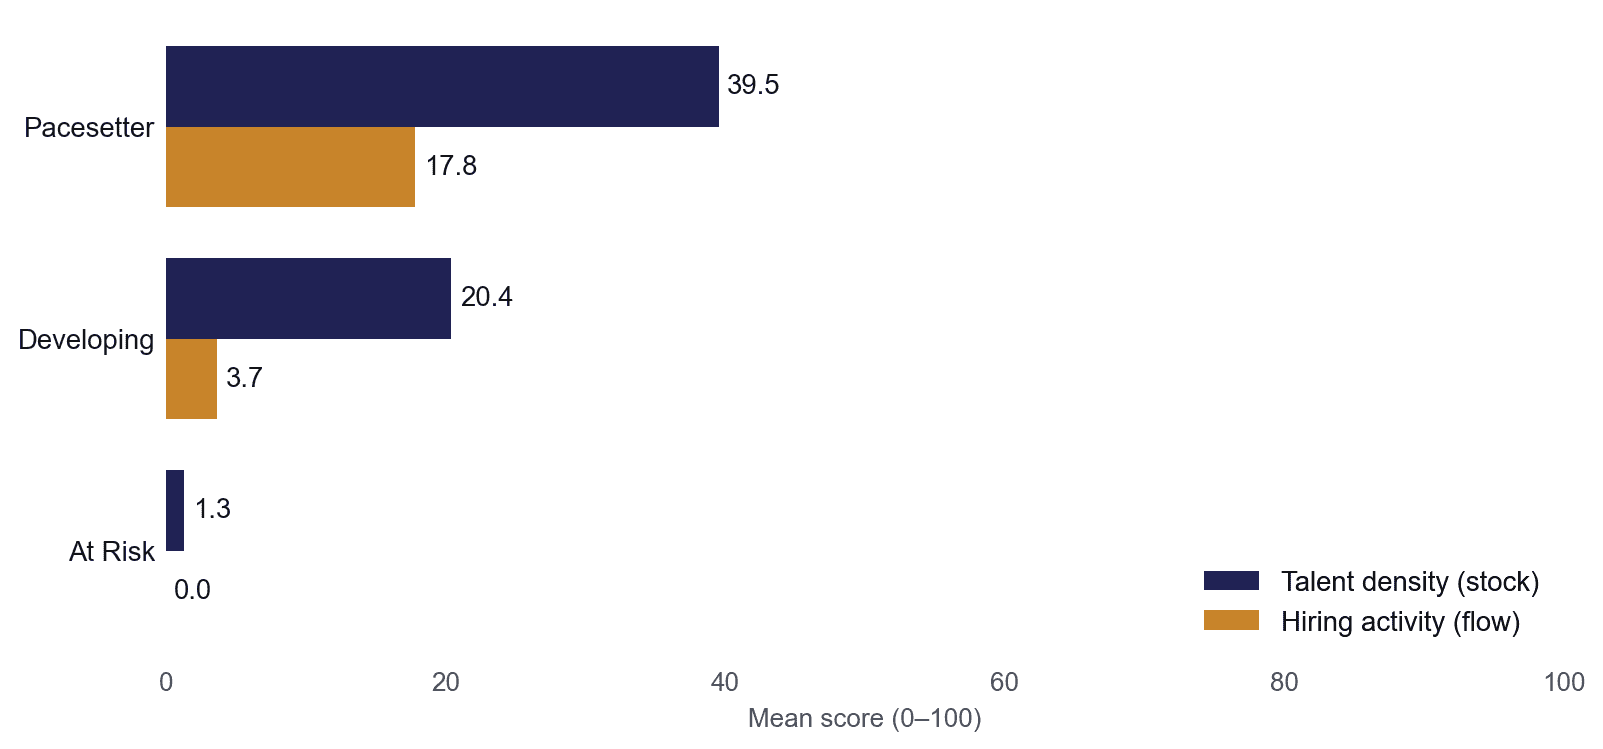
94.5% of all companies score zero on AI hiring activity. High-confidence Pacesetters average 30 out of 100.
Highest-confidence finding in the report. Holds across the full sample and across confidence tiers. Even organisations that have otherwise reached readiness are not investing in the talent pipeline that will sustain it. Waiting for the market to supply AI talent is not a working strategy.
Finding 05
The geographic divide
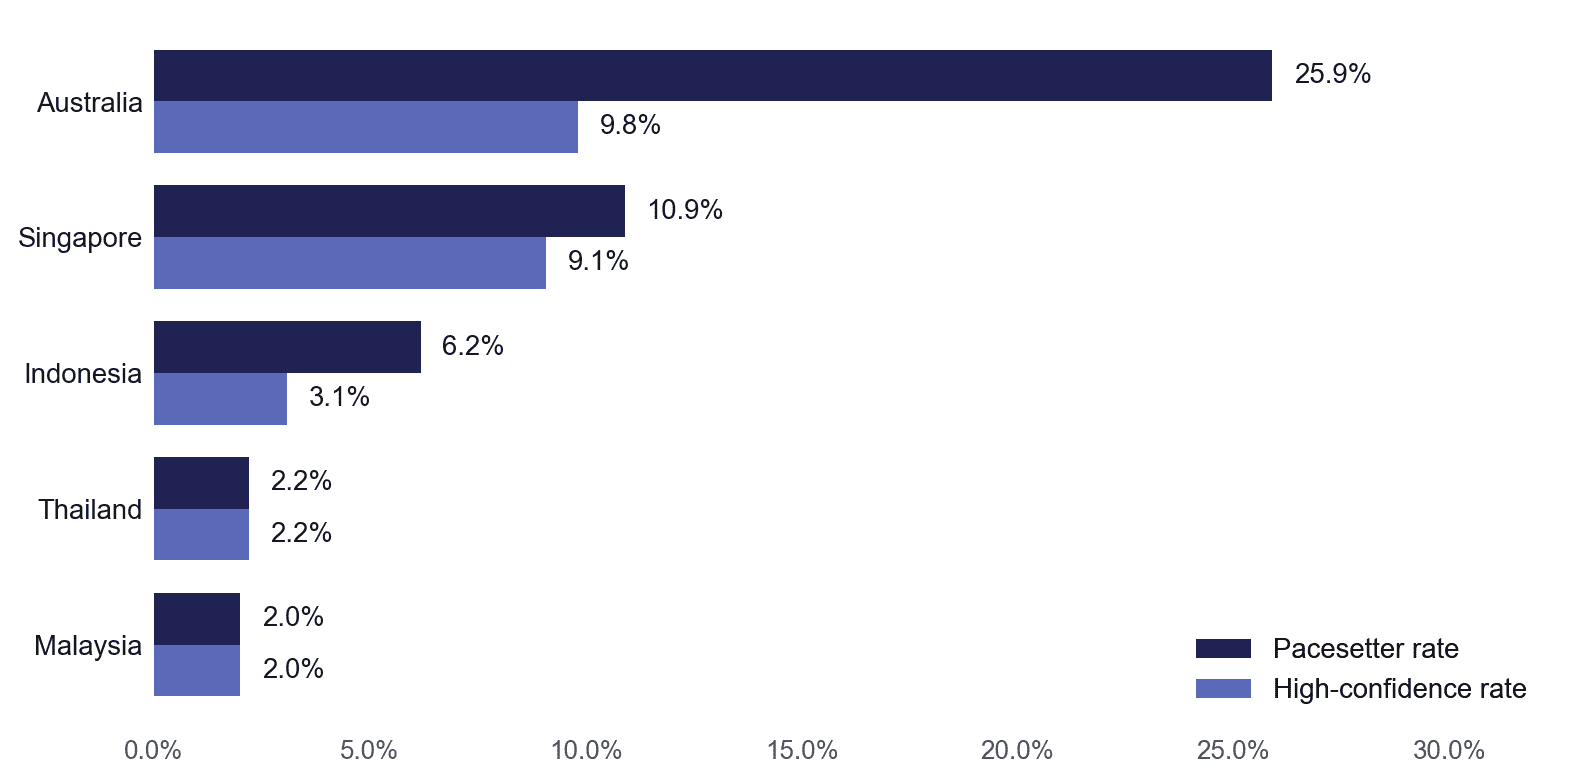
Australia: 25.9% Pacesetter rate, 10% High confidence. Malaysia and Thailand: 2% Pacesetter rate, 2% High confidence.
The asymmetric visibility finding intersects geography. Australia’s lead is not only in readiness – it is in observability. The APAC label conceals both a 13× readiness gap and a 5× visibility gap. Counter-examples exist where named: Malaysia’s Pacesetters are Pentamaster and ViTrox; Thailand’s are Omise and Muang Thai Life Assurance.
Finding 06
Two sectors carry the Index
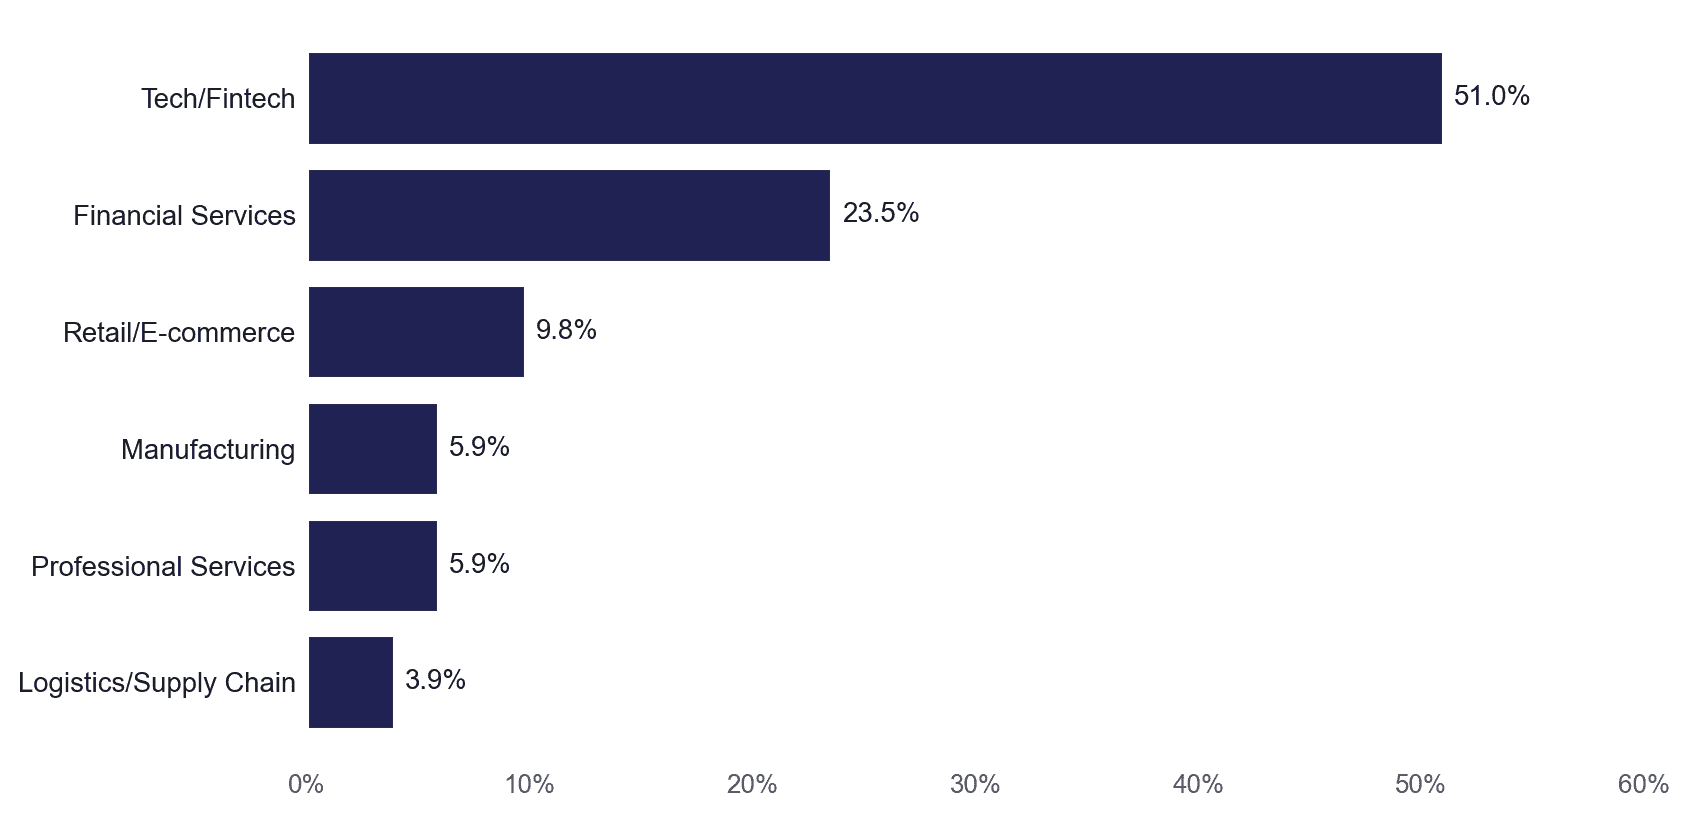
Tech/Fintech (51%) and Financial Services (24%) account for 75% of all Pacesetters.
Sector concentration is real. Manufacturing’s 88% At Risk rate partly reflects weaker observability of shop-floor AI activity – but not entirely. The manufacturing finding in the confident subset is more balanced. Both of Malaysia’s Pacesetters are manufacturers.
Five markets at a glance
australia
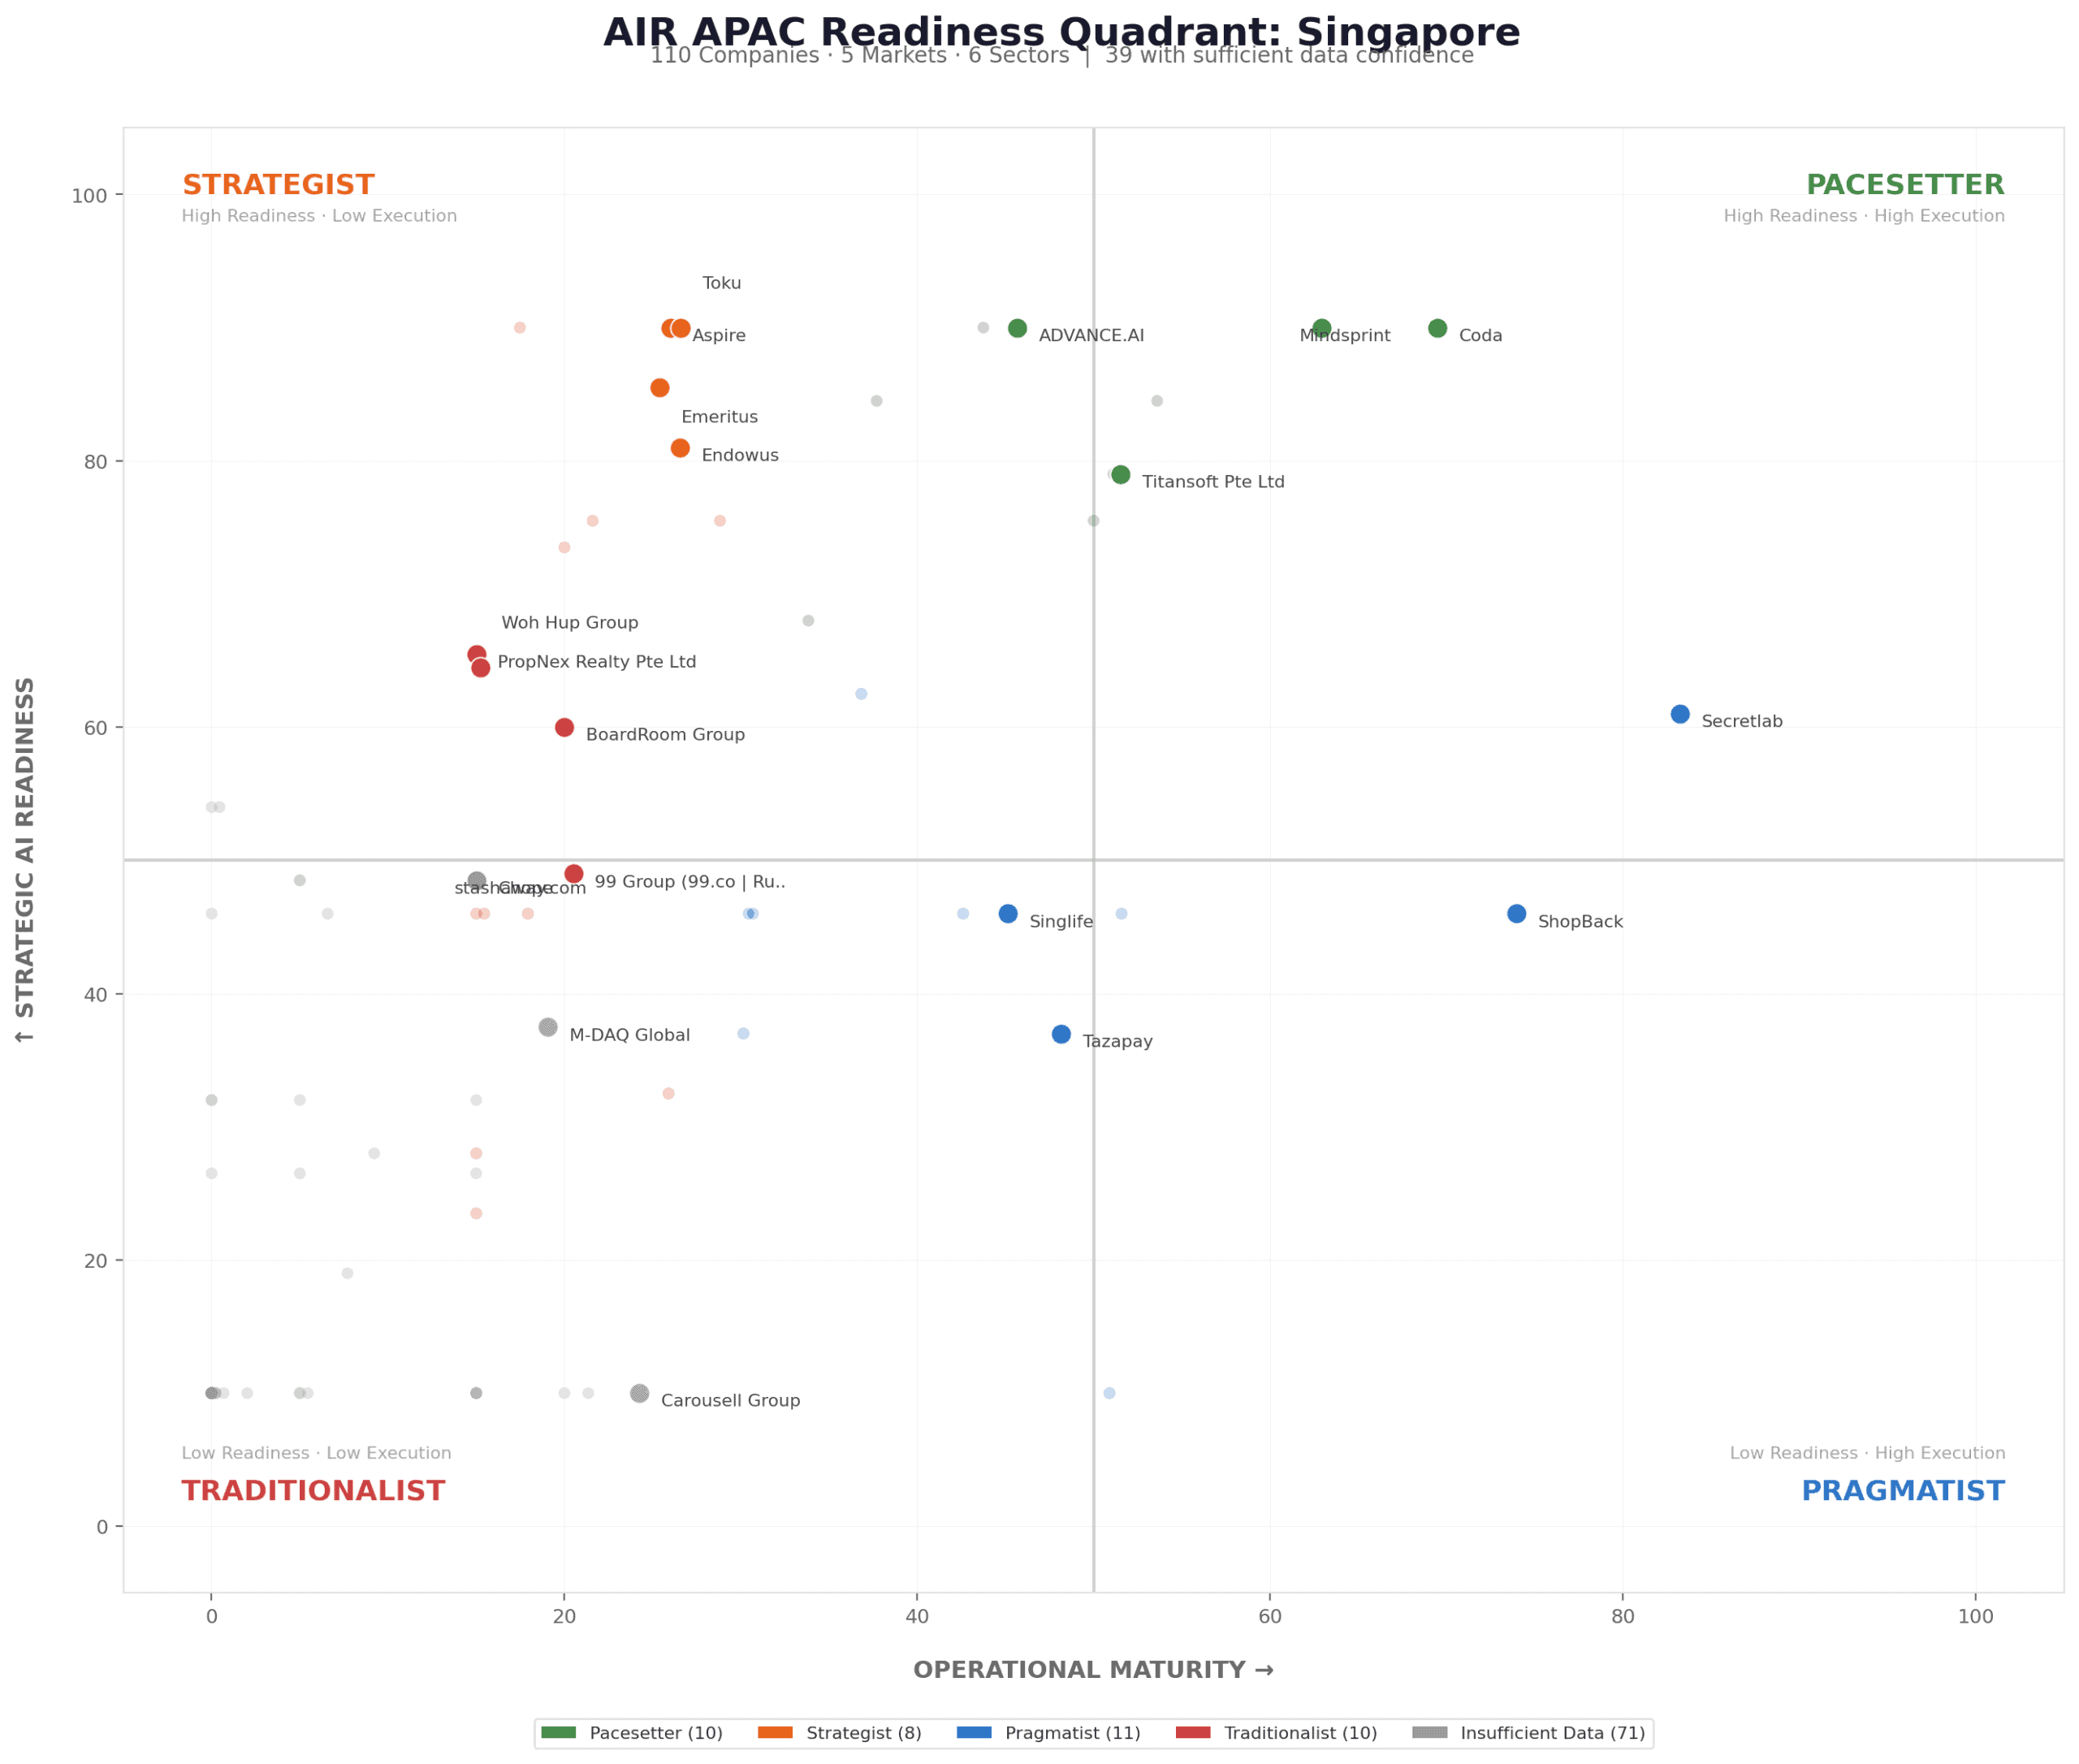
singapore
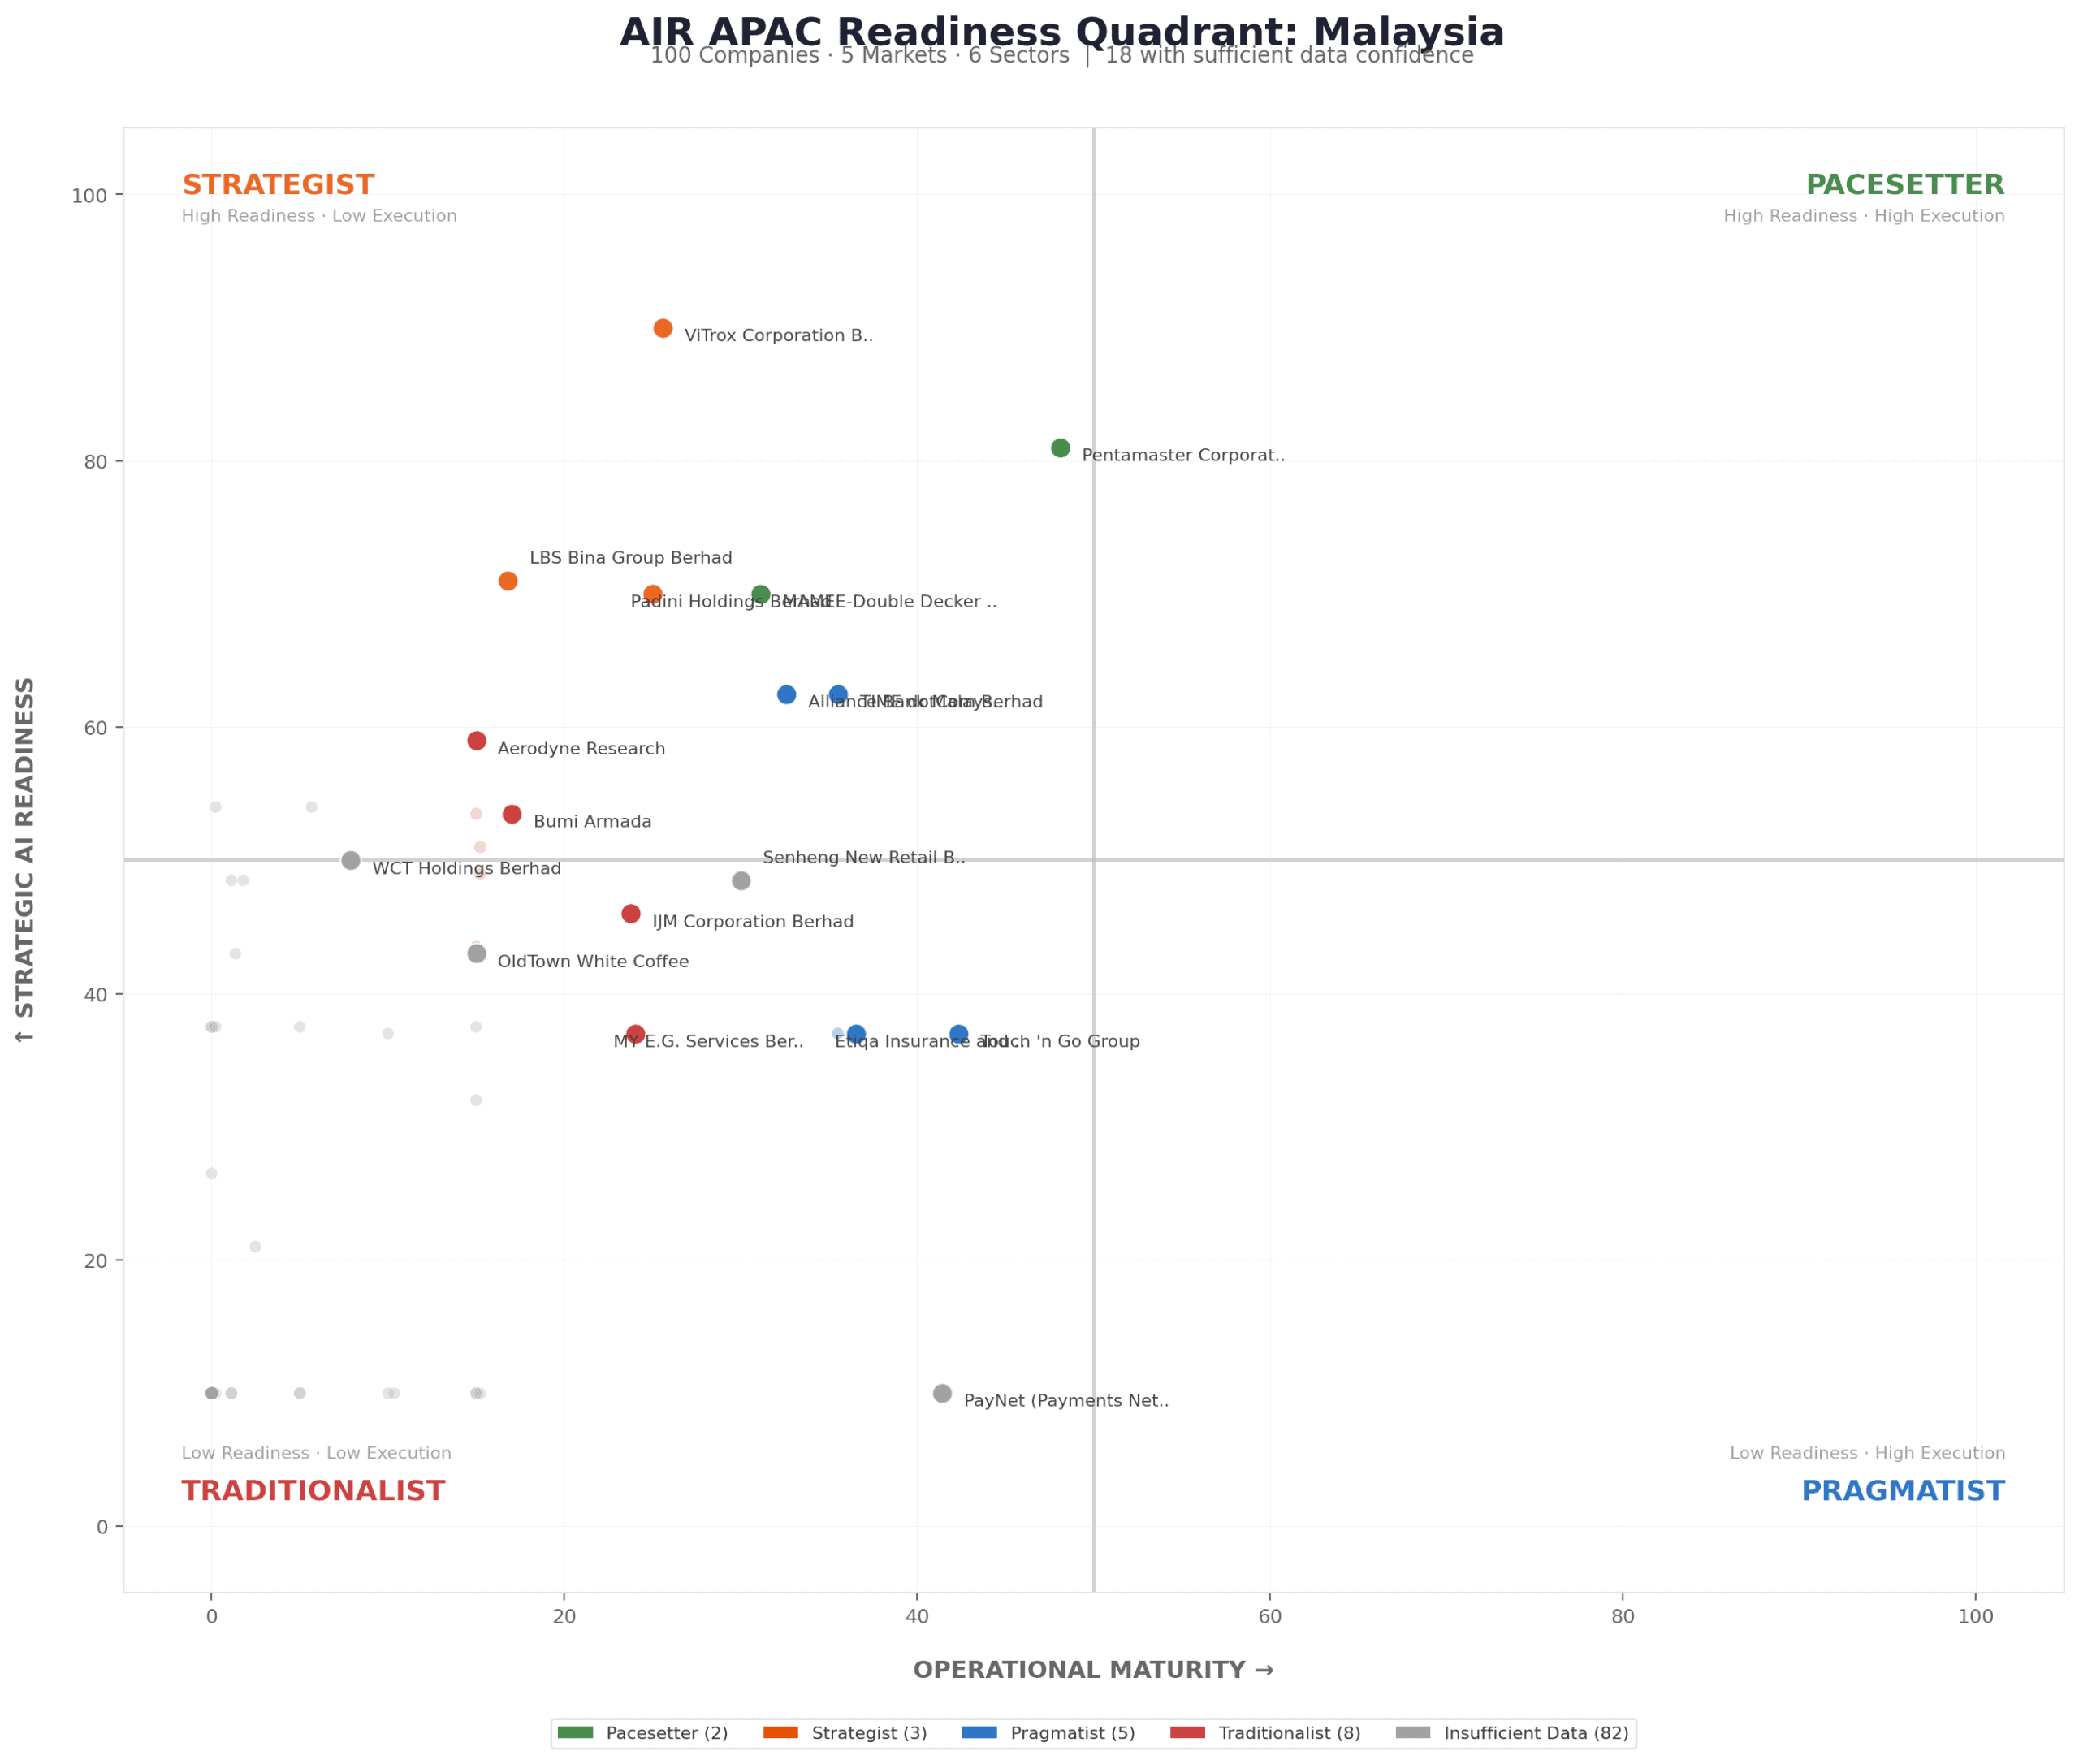
malaysia
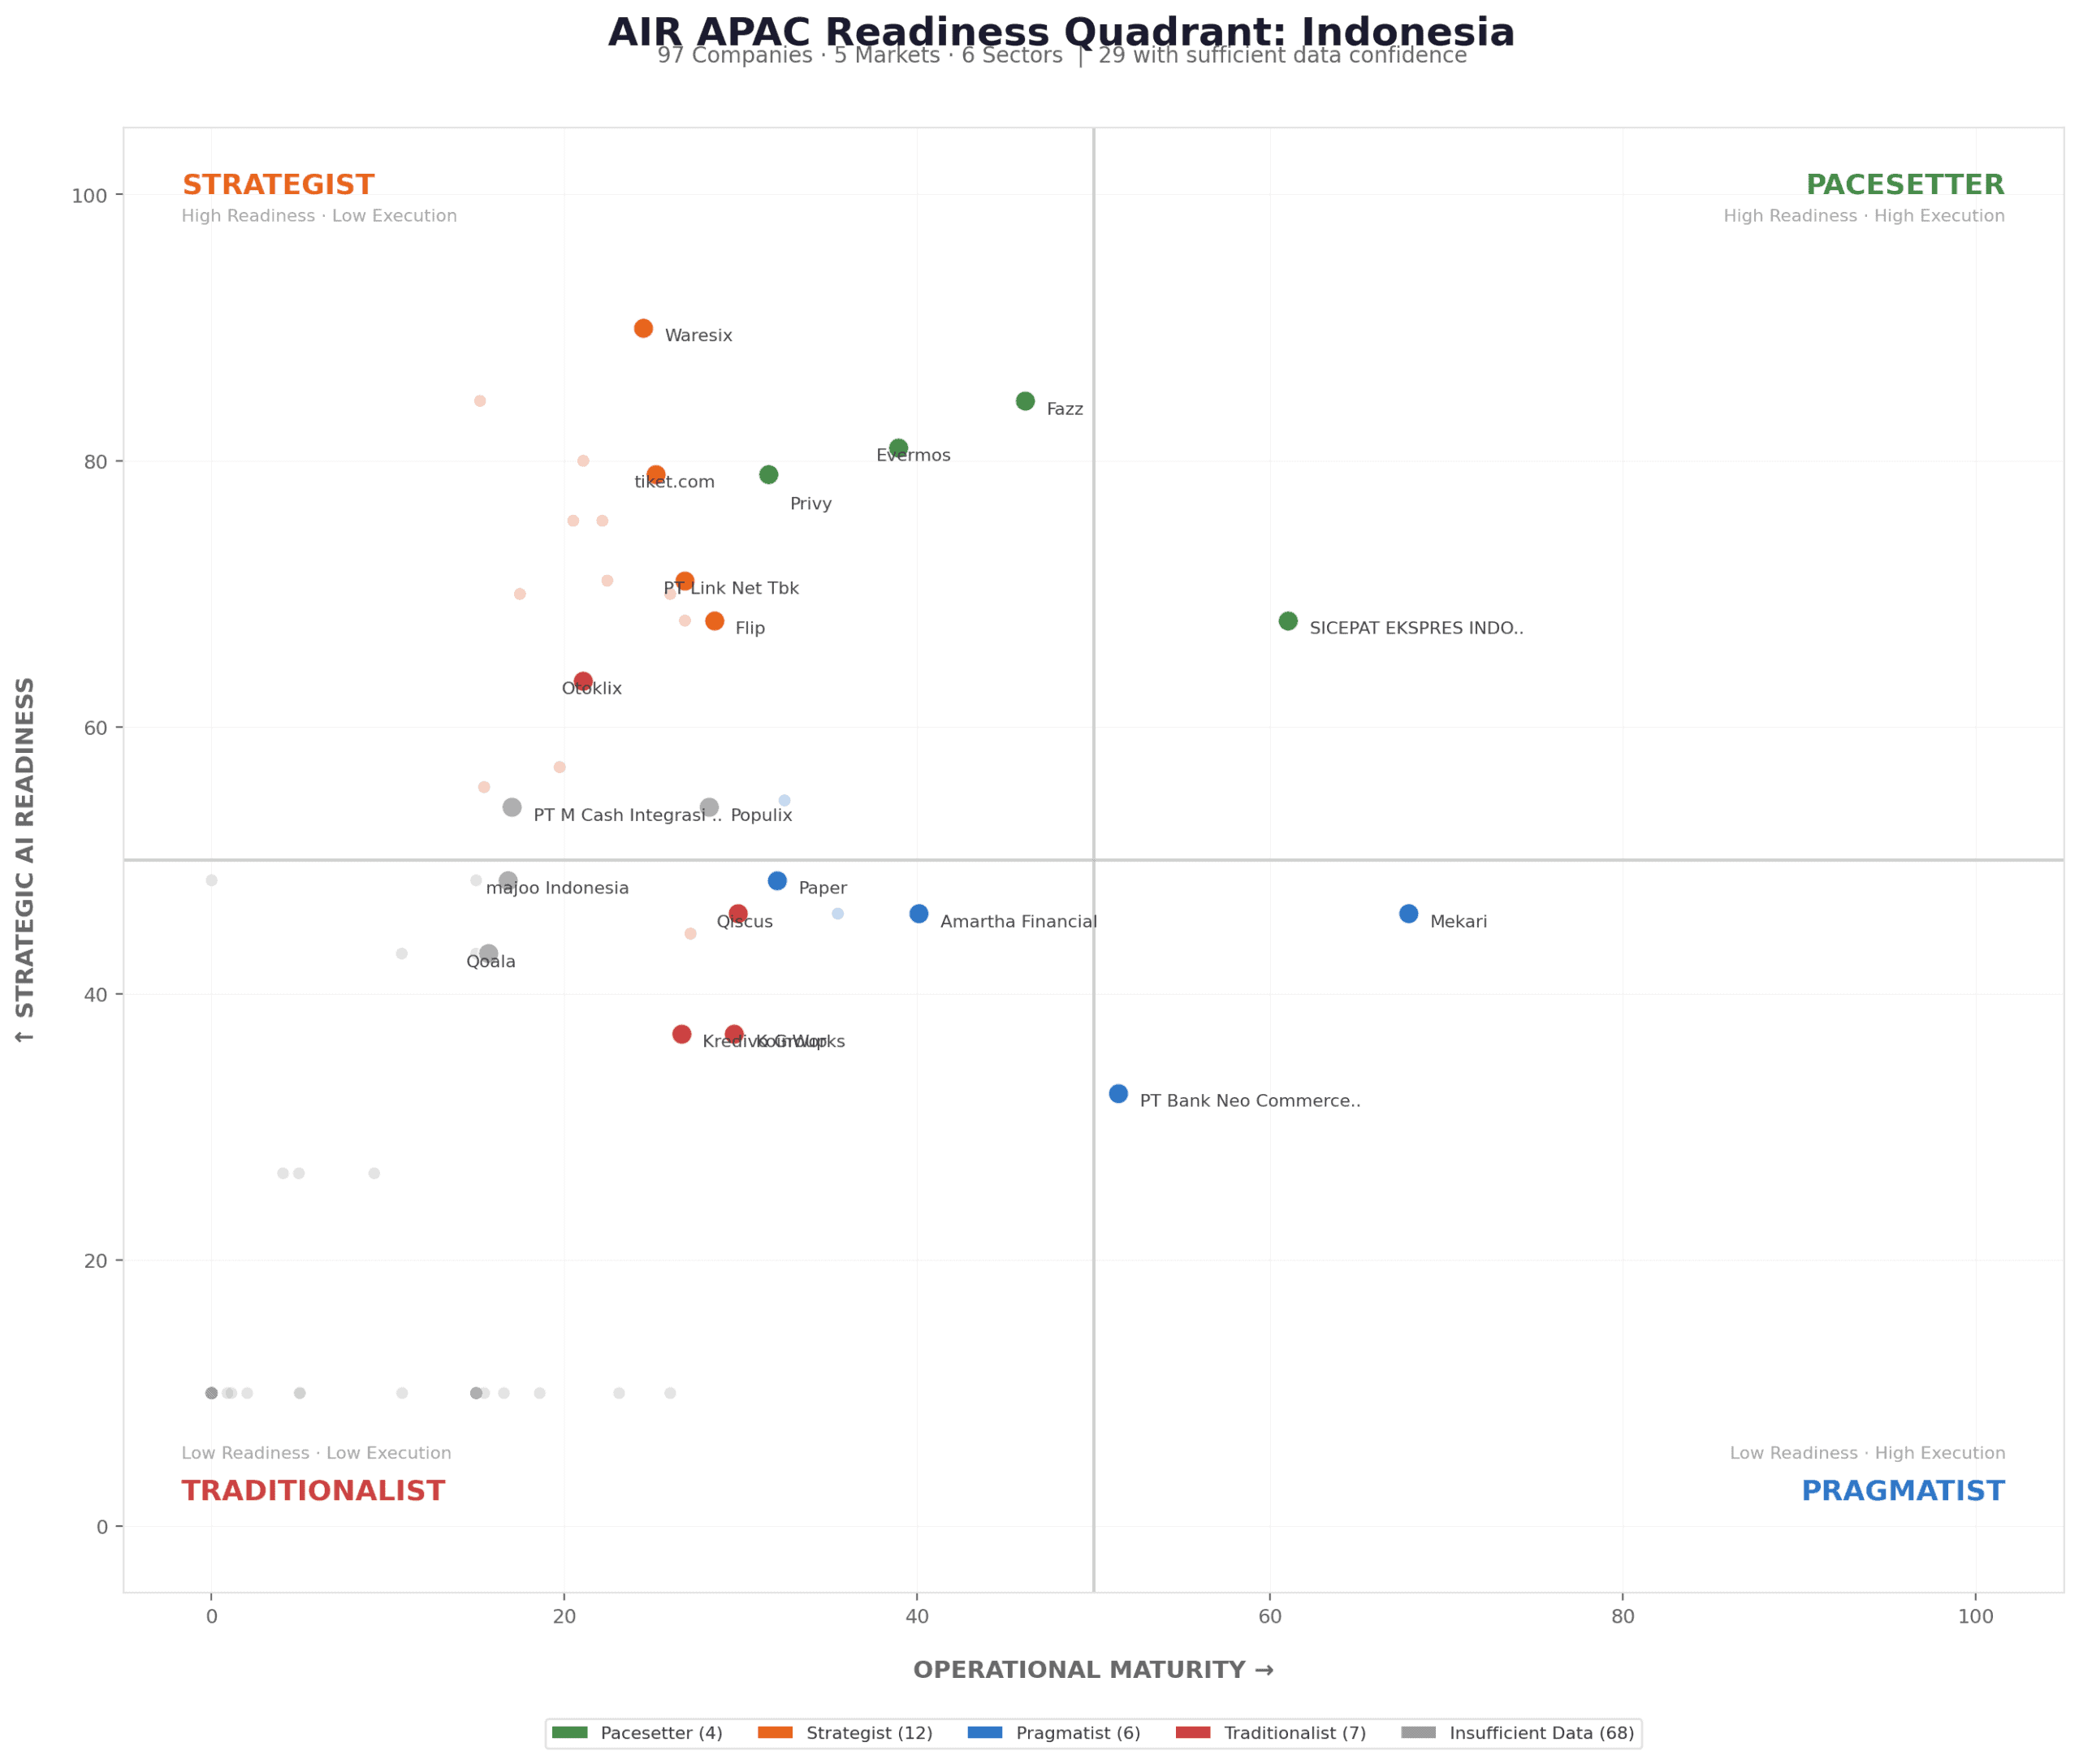
indonesia
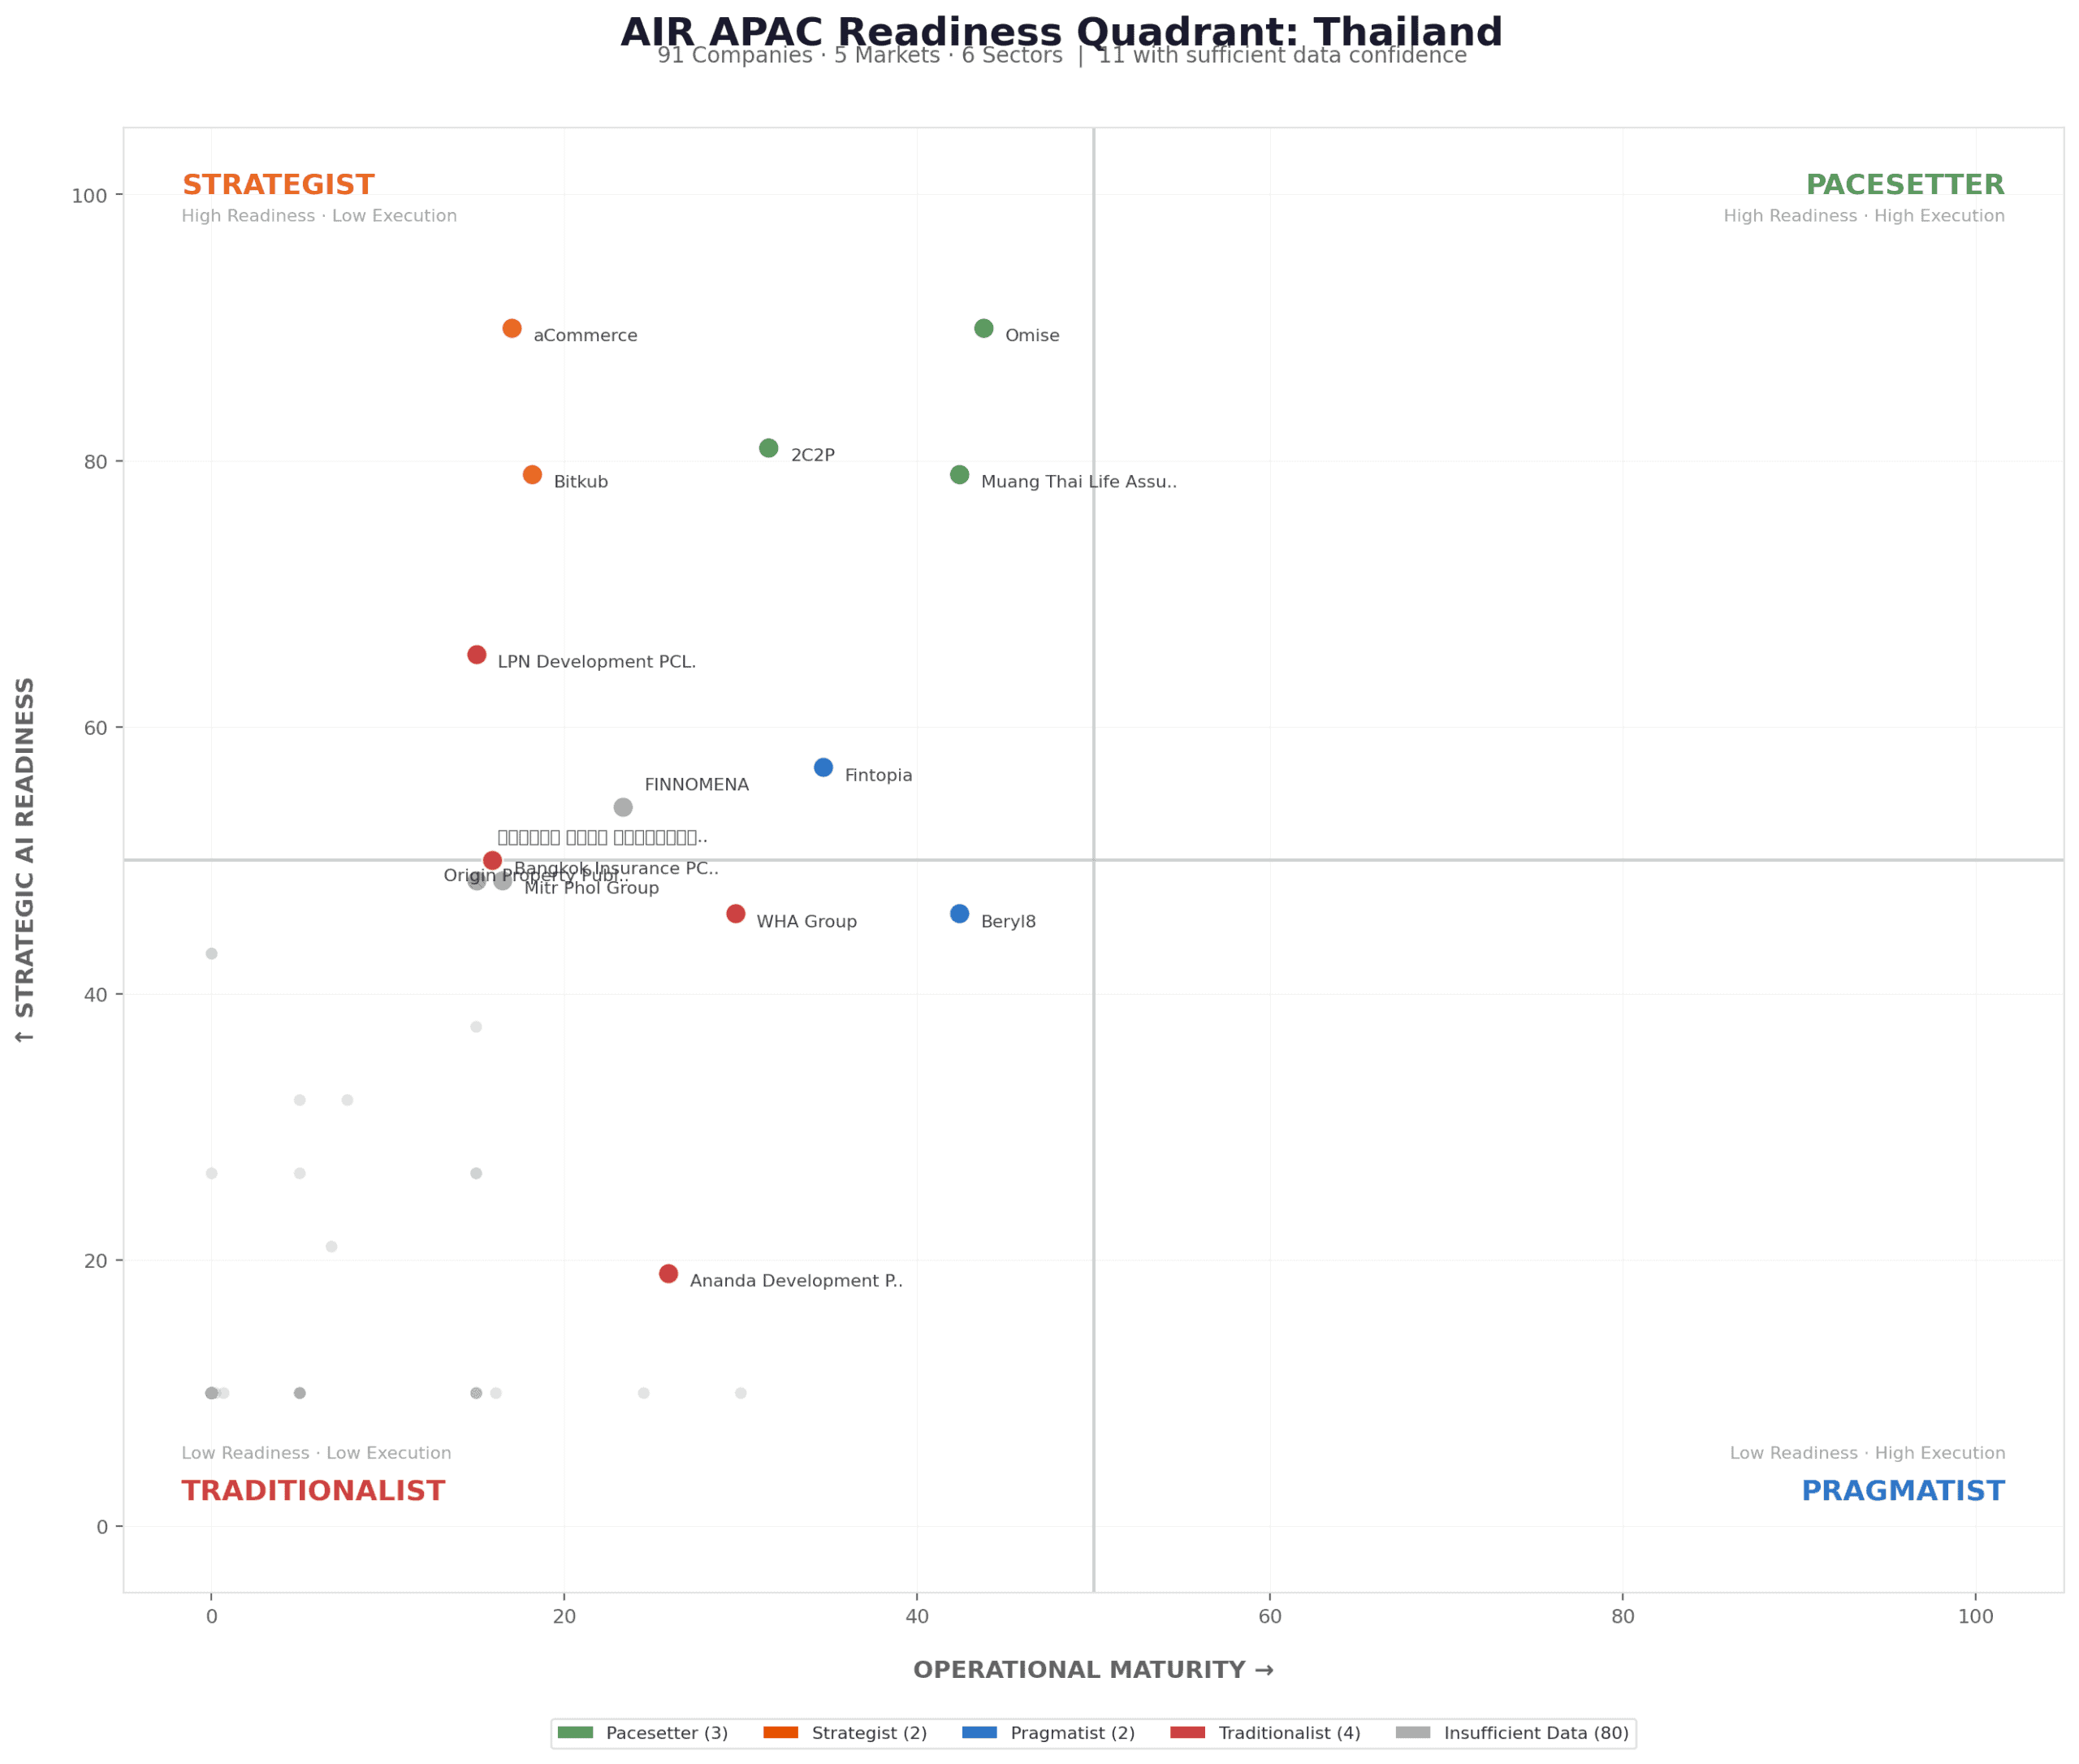
thailand
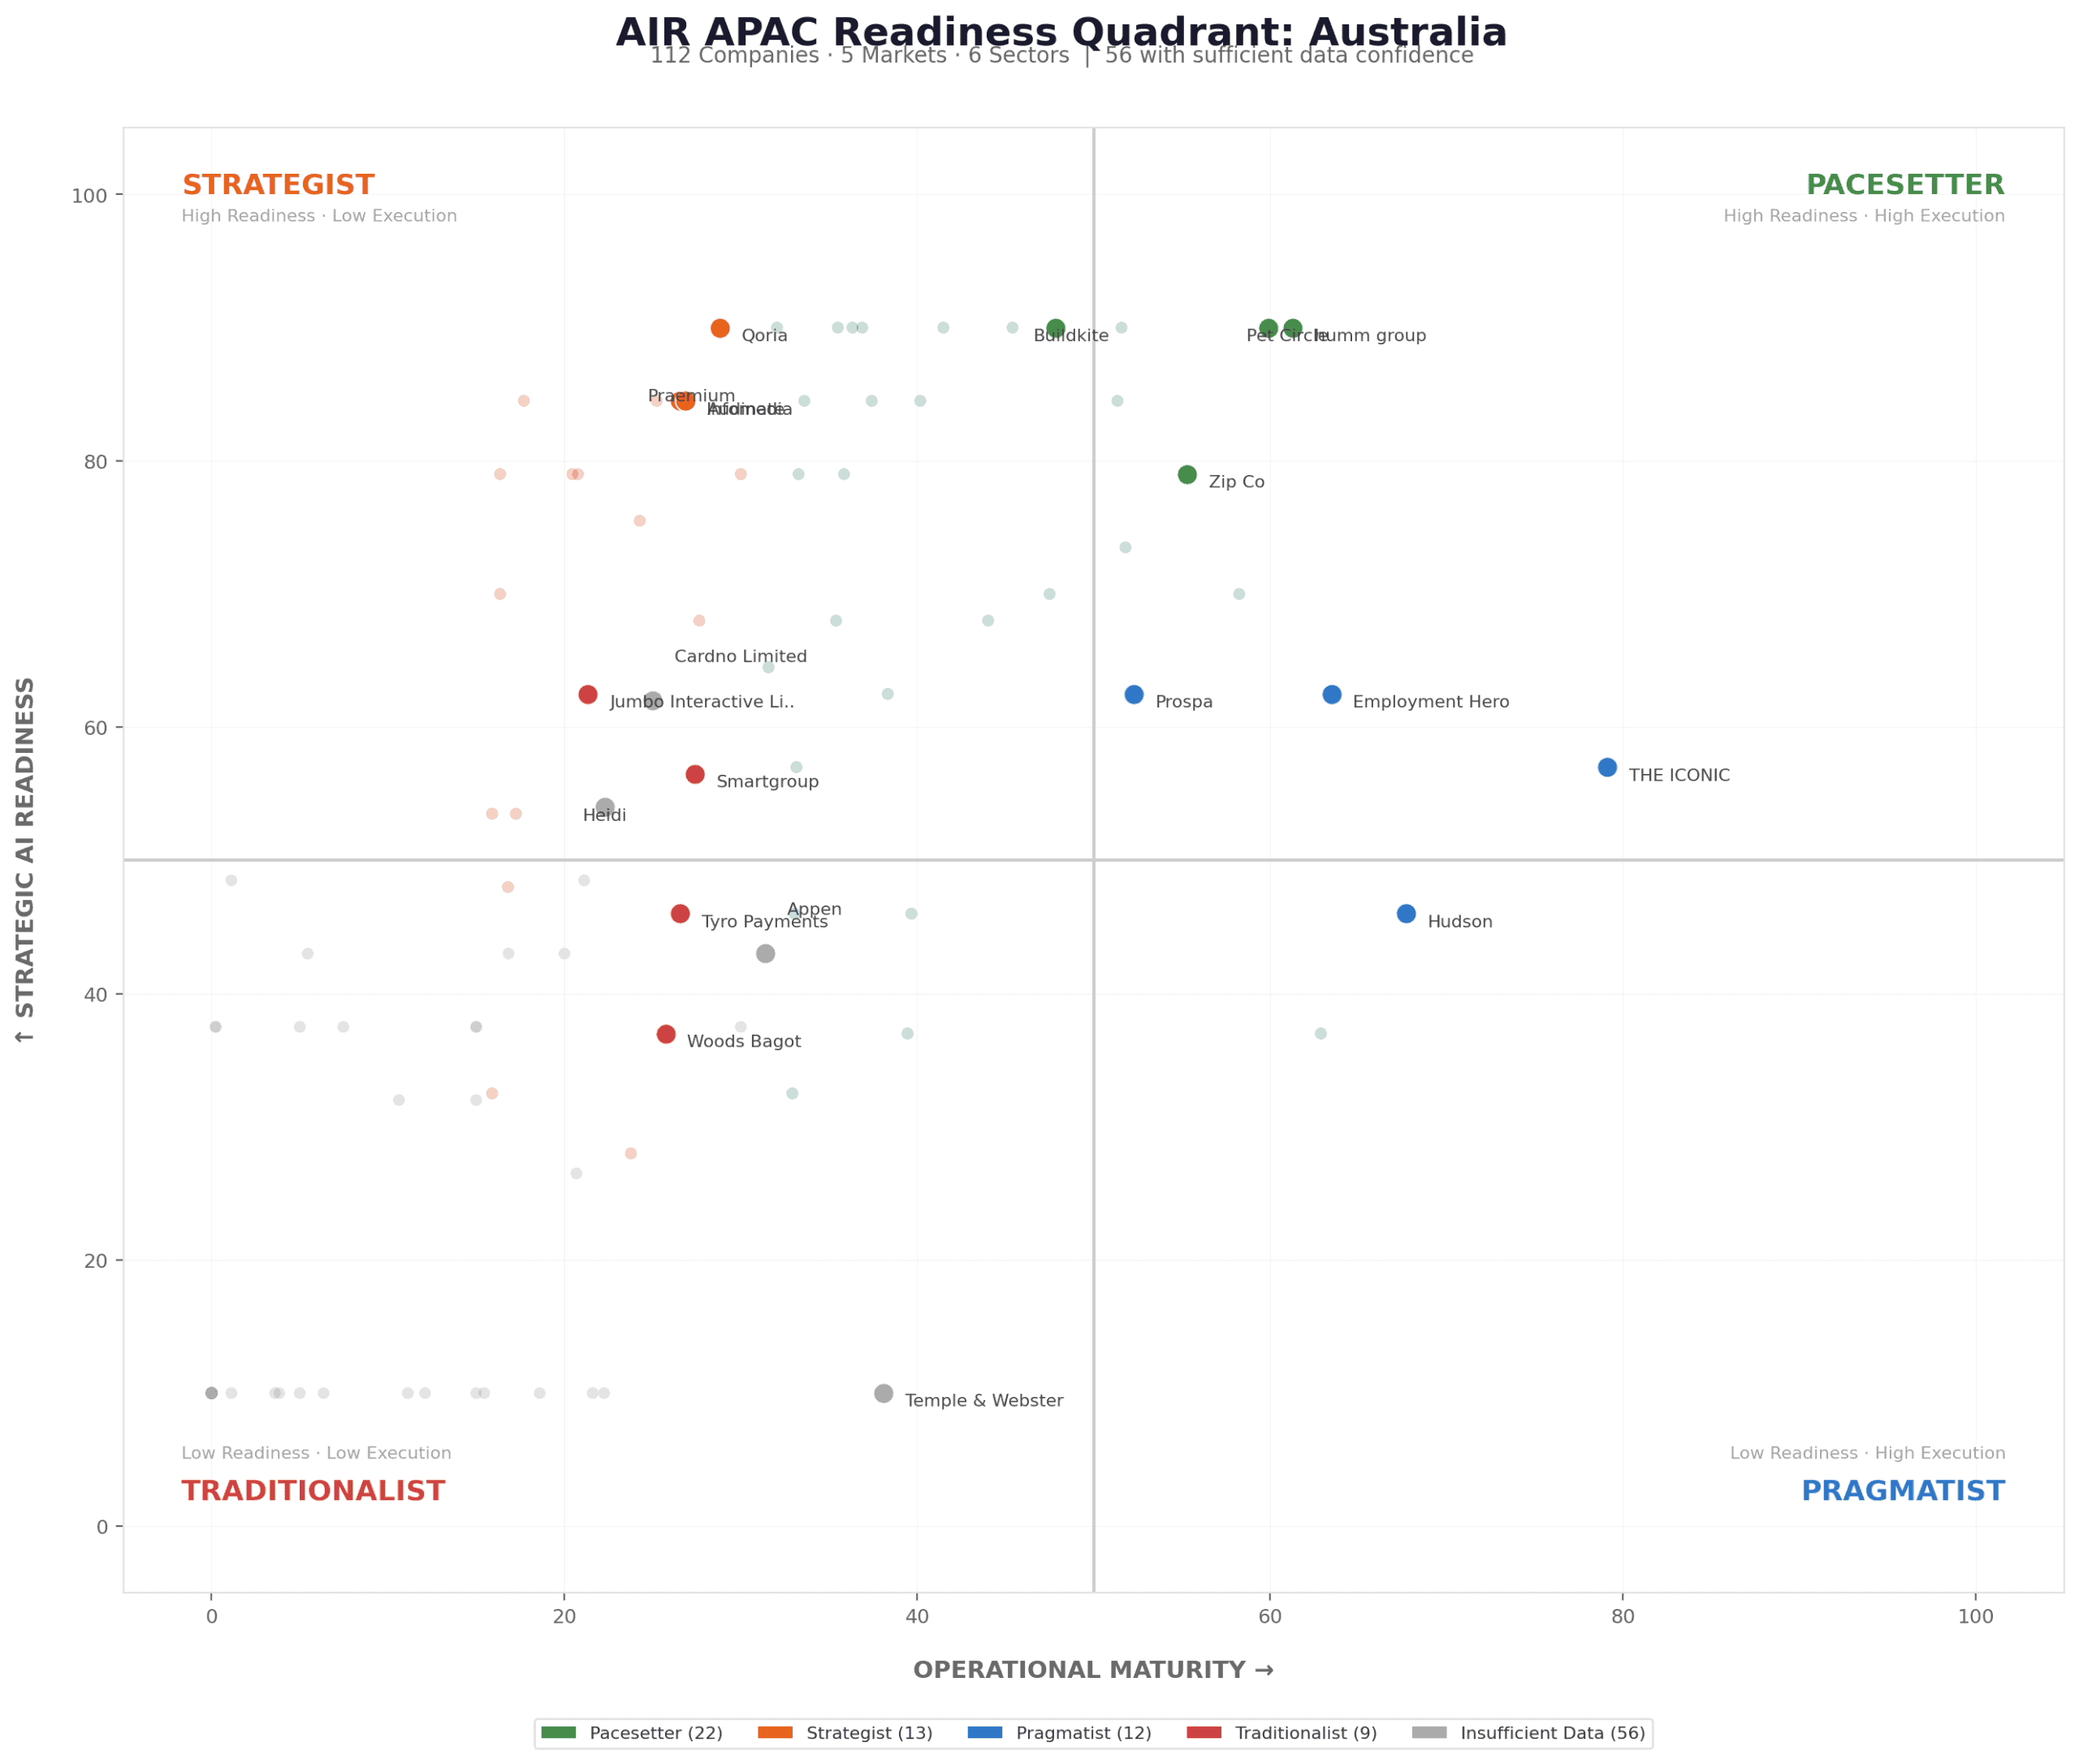
Quadrant placement: Pacesetter, Strategist, Pragmatist, Traditionalist. Companies with insufficient signal density (357 of 510) are not plotted.
Methodology
Measure what companies do, not what they say.
Three-layer scoring · TRS 0–100
- Digital Footprint (25%) – cloud infrastructure, ERP systems, technology stack maturity
- Talent Capacity (45%) – AI/data talent density, digital generalists, active hiring signals
- Strategic Intent (30%) – public narrative, digital commitment evidence
Weights are hypothesis-driven. They reflect the analytical judgment that talent signals are the most reliable and discriminating data currently available for APAC mid-market companies.
Confidence framework
- High confidence – 28 companies (5.5%): full signal density across all three layers
- Medium confidence – 125 companies (24.5%): partial signal density, scoreable with caveat
- Low confidence – 357 companies (70.0%): insufficient publicly observable signal
A score is not a verdict. Cross-market comparisons must be read as a composite of readiness and observability.
What’s next
Q2 2026 forthcoming
The Confidence Floor
A targeted Q2 brief on what raises a Low-confidence company to Medium. The signal density threshold, the cheapest interventions, and what visibility actually buys an organisation that has already invested in readiness.
Annual flagship
The Index, Year 1
The annual publication of the full Mid-Market Readiness Index. Longitudinal tracking begins with Q4 2026, with the first year-on-year comparison published in early 2027.
Partnership work
Sector and city deep-dives
Joint research collaborations applying the Index methodology to specific verticals – including the the partner organisation × AIR APAC tourism collaboration, with extension paths into financial services, manufacturing, and urban tourism.
The AIR APAC Mid-Market Readiness Index, Q1 2026 · Published April 2026 · A research publication of the Center for AI Readiness, Asia Pacific.