
Research / Markets
Five markets, one dataset, asymmetric visibility.
The Q1 2026 Index covers 510 mid-market companies across Singapore, Australia, Malaysia, Indonesia, and Thailand. Per-market dossiers below summarise sample size, mean readiness, named Pacesetters, and sector mix. Cross-market comparison must be read as a composite of readiness and observability.
| Market | Companies | Mean TRS | Mean DVS | Pacesetter rate (confident) | Dossier |
|---|---|---|---|---|---|
| Singapore | 110 | 19.1 | 24.2 | Visibility-led | Open -> |
| Australia | 112 | 27.0 | 32.1 | 25.9% | Open -> |
| Malaysia | 100 | 11.3 | 15.1 | 2% | Open -> |
| Indonesia | 97 | n/a | n/a | 2 named | Open -> |
| Thailand | 91 | 10.0 | 10.4 | 2% | Open -> |
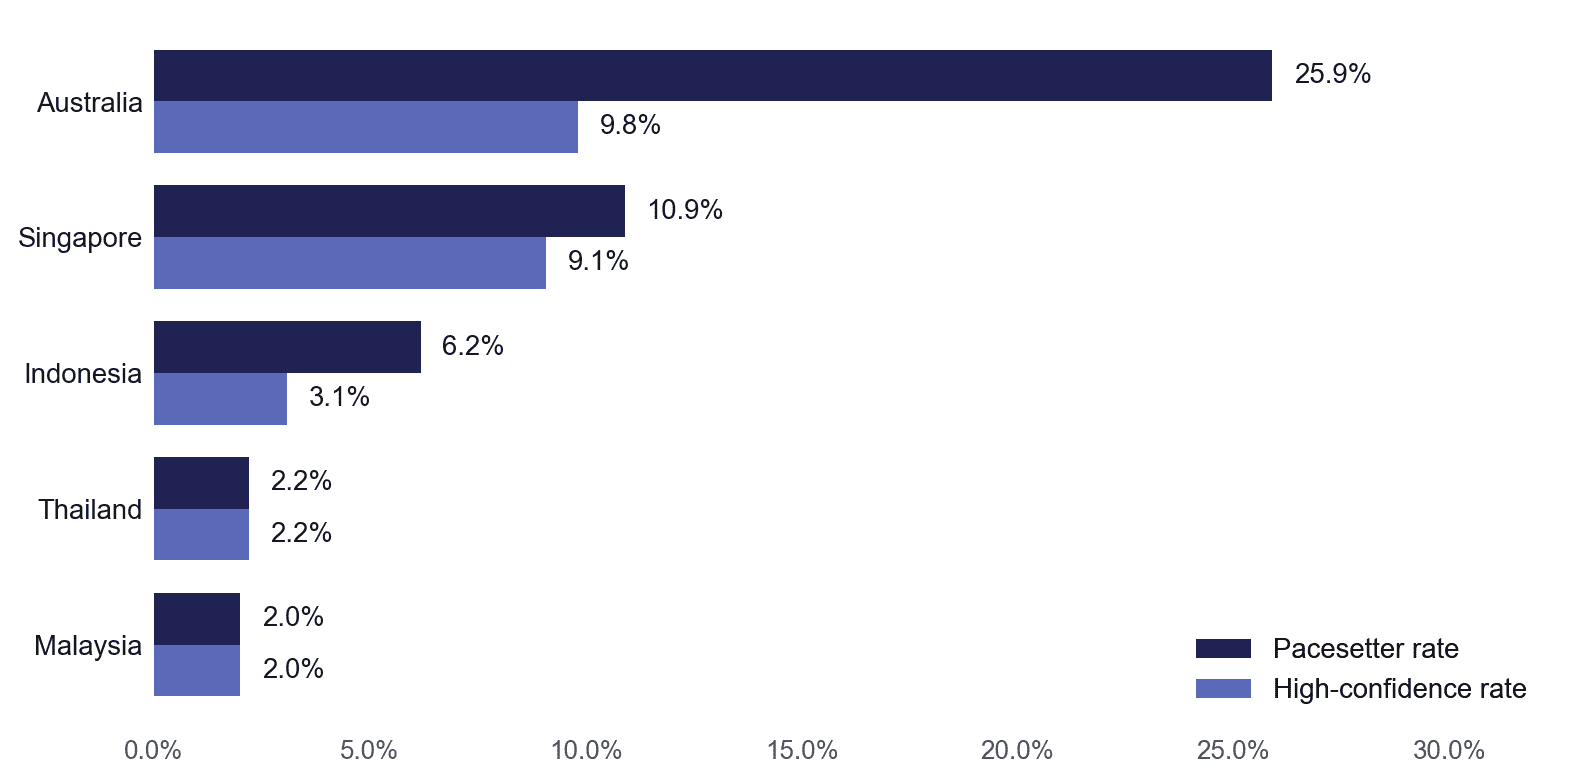
Mean TRS and DVS are calculated across the full sample for each market, including Low-confidence companies. Readers should treat cross-market differences as a composite of underlying readiness and observability. Australia and Singapore pair high readiness with high visibility; Thailand and Malaysia pair low readiness with low visibility. The TRS-DVS correlation across the full 510-company universe is r = 0.86.
Reading the dossiers
Each market dossier contains the same six sections: sample, headline numbers, ecosystem context, named Pacesetters, sector and confidence mix, and the market narrative. Quadrant charts plot the confident subset only – companies with insufficient signal density are not plotted.
Read the full methodology ->
Download the white paper (PDF) ->