
Bridging the AI Readiness Gap in Asia Pacific
Mid-market enterprises, and why the tools built to measure them cannot see them. The inaugural AIR APAC white paper: 510 companies scored across five markets and six sectors from behavioural public signals.
Open the paper
Every artefact in the Evidence family opens direct: no form, no account and no email address.
Korean edition
The Korean edition is the same item in a second language, not a second publication. The language switch sits on this item.
Not yet served from airapac.org
Across Asia Pacific, the 200 to 3,000 employee firms that form the backbone of every market are struggling to turn AI ambition into execution. The paper finds that the first problem is not capability but legibility: the platforms built to measure AI readiness were built for North American and European enterprises, and they undercount APAC companies in two ways, by leaving firms out entirely and by mis-measuring the ones they do list.
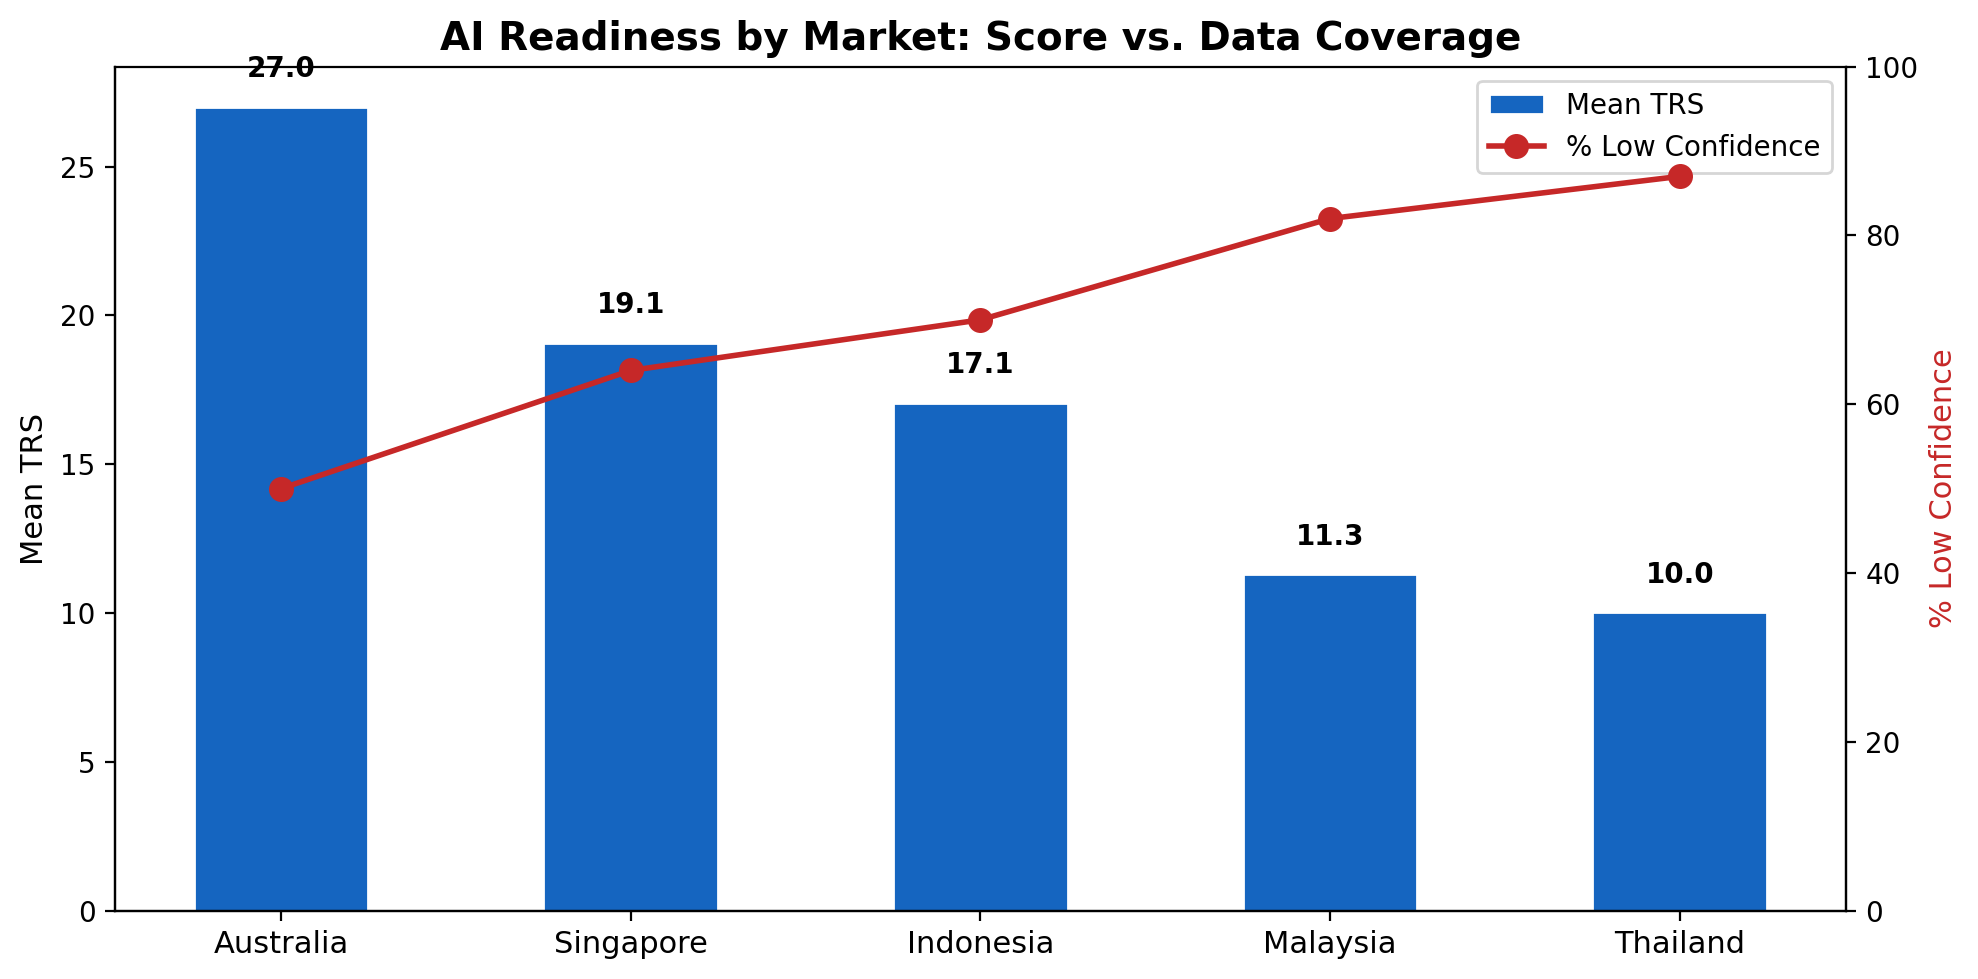
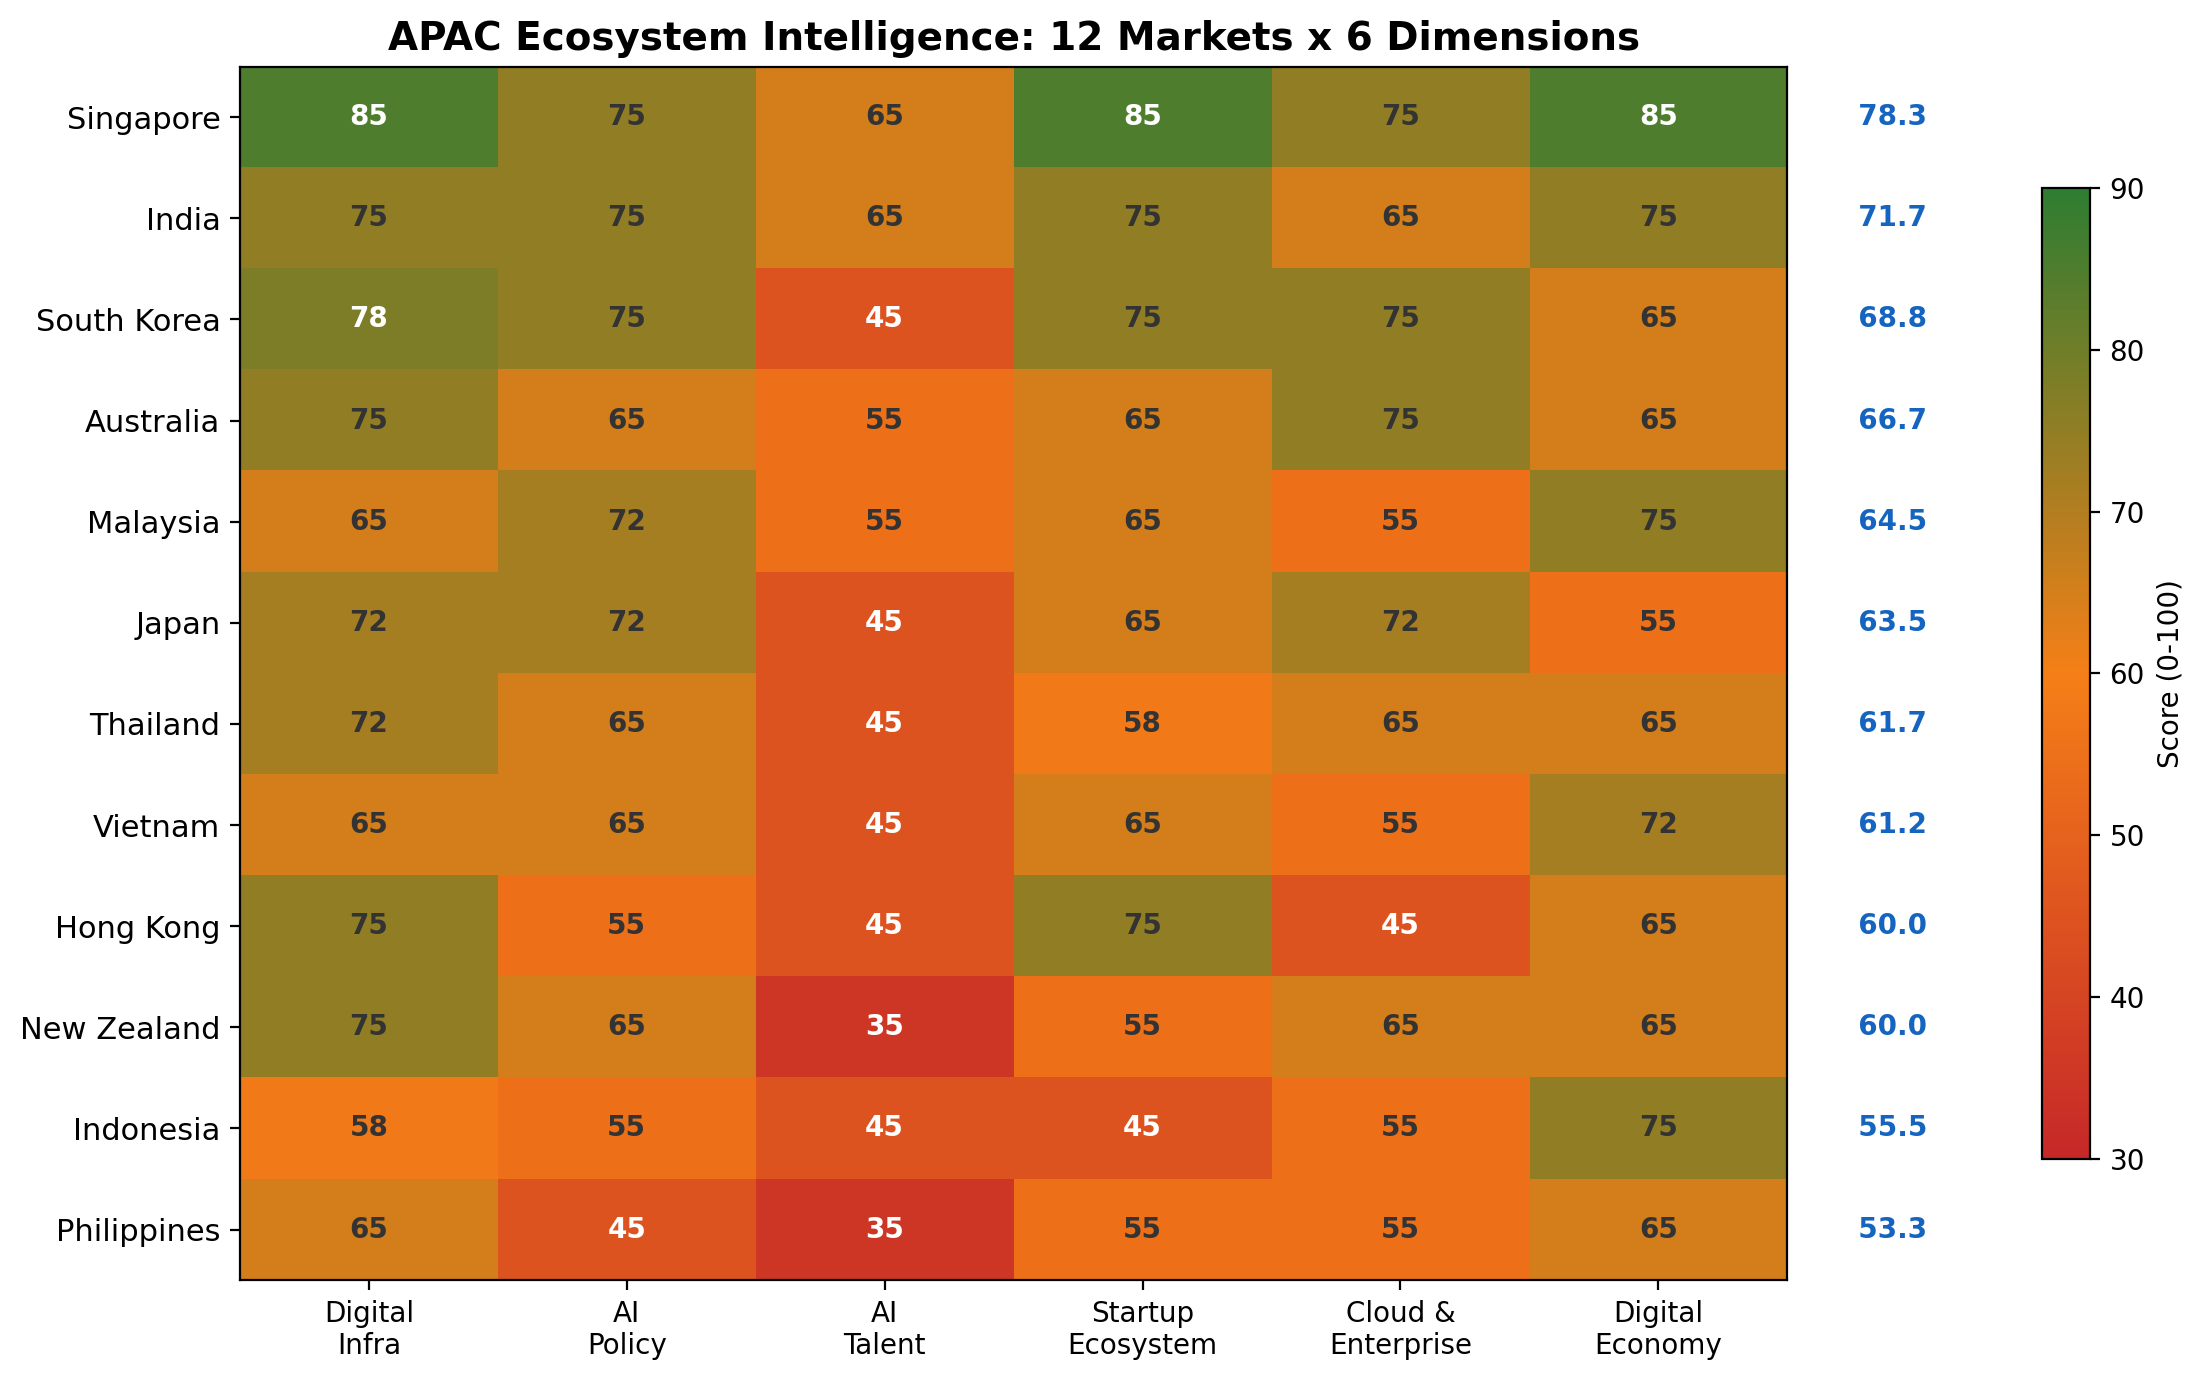
AIR APAC calls this the APAC Data Desert. It matters because a pipeline that returns no data cannot tell a company with no AI capability from a company that is simply not observable, so a cross-market score is a composite of readiness and observability. The paper sets out the method, the quadrant framework, the twelve-market ecosystem context, and the human capital constraint that survives every adjustment: no market in the ecosystem analysis scores above 65 on AI Talent Pool.
The basis for this paper
- Claim
- The APAC mid-market is not only lagging in AI adoption; it is systematically invisible to the tools used to measure it, and the mid-market is where the readiness gap is widest.
- Source
- Bridging the AI Readiness Gap in Asia Pacific, Mid-Market Enterprises. AIR APAC Mid-Market Readiness Index, inaugural edition, version 2, April 2026. Published by AIR APAC; the instruments and pipeline are built and operated by Exeter Labs.
- Period
- Q1 2026 data vintage. The paper was published in April 2026.
- Population
- 510 mid-market companies of 200 to 3,000 employees, scored across five markets (Singapore, Australia, Malaysia, Indonesia and Thailand) and six sectors, with a twelve-market ecosystem analysis for regional context.
- Method
- Behavioural public signals rather than self-reported surveys: cloud platform signals, specialist hiring activity, ERP system detection and analysed strategic communications. The company score is a public-evidence visibility score, Total Readiness Score against Data Visibility Score, not verified readiness.
- Limitation
- 70 percent of the scored companies sit at Low evidence confidence, so their scores are excluded from the Pacesetter tier and read as directional. Cross-market scores combine readiness with observability. Absence from the index is not a finding of low activity. The twelve-market ecosystem scores are country-level context and are not part of the company index.
What this paper does not claim
- It does not claim that any company has deployed AI or extracted a return from it. A high score means the preconditions observable in public signals are in place, not that an outcome exists.
- It does not claim that a company missing from the index has low AI capability. In public signals, invisible and inactive are indistinguishable.
- It does not rank markets against each other. Separation between markets changes with how deeply each one is measured.
- It does not certify anyone. The Index rates organisations; AIRS-J/1 certifies individuals, and only through a separate assessment on the official instrument.
- It does not present the company score as audited or verified. It is public-evidence visibility, and it says so on every page of the data.
Findings in figures
Two figures carry the central finding. The first shows readiness falling as measurement quality falls; the second shows the same desert at country level, where the AI Talent dimension is the weakest cell in almost every market.
Related evidence, in the same unit of analysis
These are organisation-level pieces, the same unit of analysis as this paper. None of them leads to a certification surface.
- Asymmetric Visibility, Q1 2026 findings report: six findings from the same 510-company dataset, PDF, 43 pages, 0.6 MB.
- AI Readiness Index, Q2 2026 data: the published 1,000 organisations as a CSV, 116 KB, 1,000 rows.
- How the Q2 2026 Pulse is built: the current method on one page.
- What this index cannot tell you: the published limits, held at the same detail as the internal list.
Next step
Read the market patterns
The organisation-level evidence continues on the market pages: per-market readiness, the scored set, and the dossier for each. If you need a sector reading, the sector index sits beside it.