

Research
The AIR APAC AI Readiness Pulse, Q2 2026.
1,000 APAC organisations ranked by public AI readiness signal (RPS), an outside-in visibility measure across 23 markets and 6 sectors. Screened from 5,820 candidate organisations across the region. Scores reflect public-evidence visibility, not verified readiness.
Data collected January–June 2026. Published July 2026. Version Q2 2026.
What the data shows
Three findings from Q2 2026.
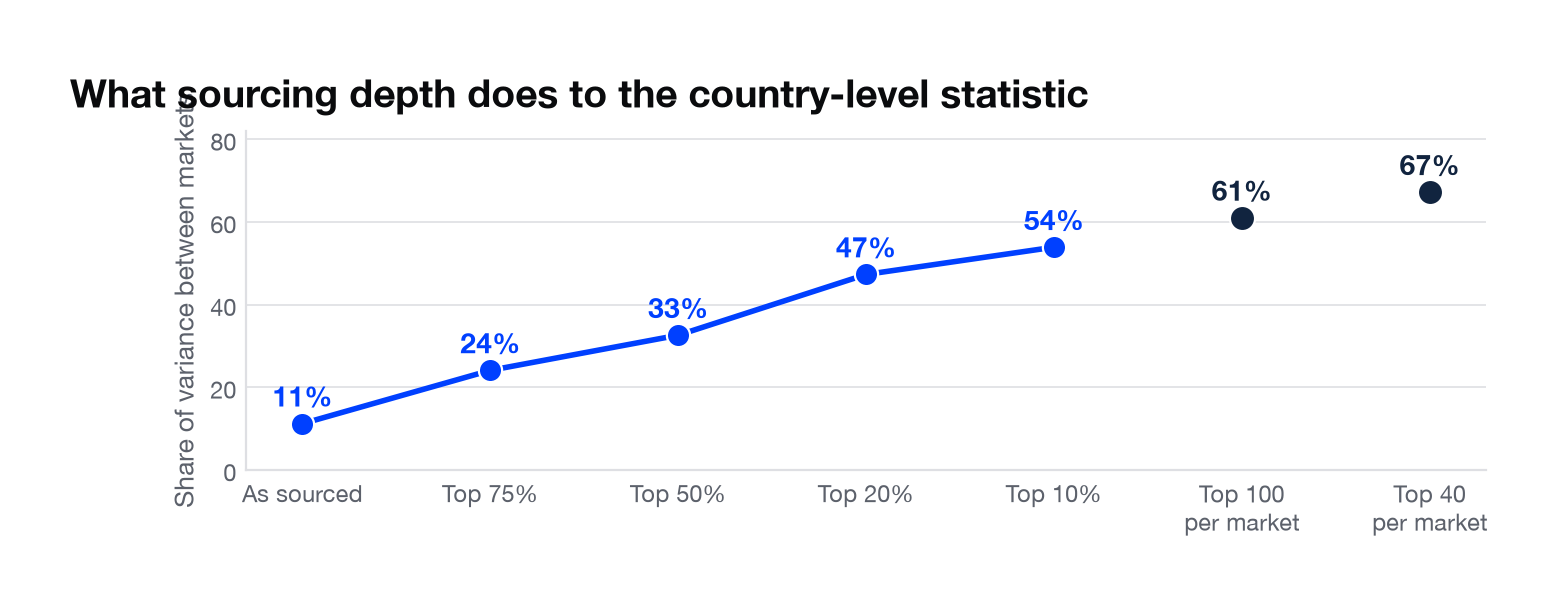
Market separation appears stronger at the visible frontier and weaker in the tail, but the statistic changes materially across sourcing-depth slices. The series is publishable; no single value supports a market ranking.
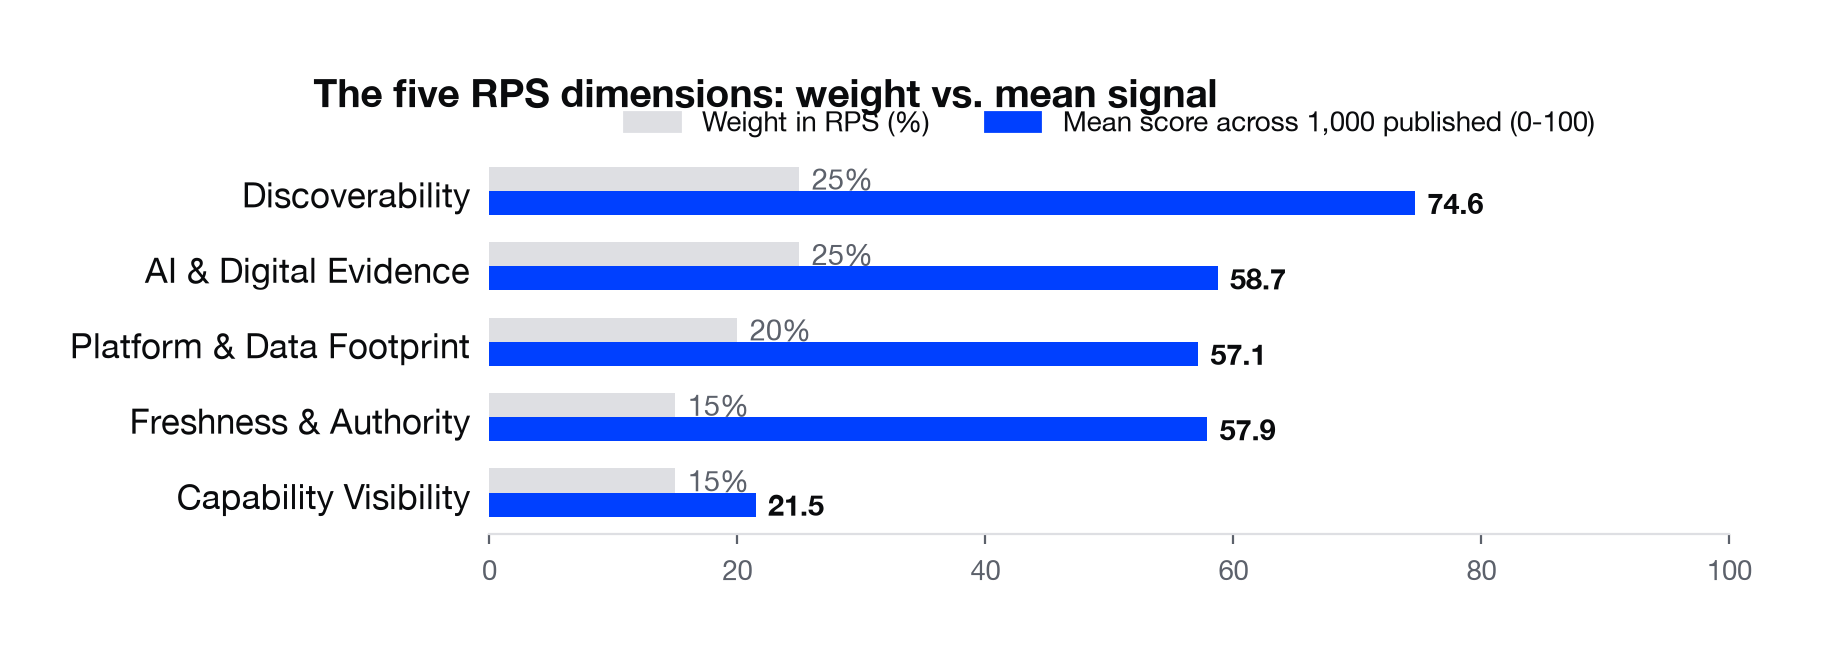
See the depth check →Capability Visibility scores lowest of the five RPS signals. Organisations publish AI intent faster than they publish AI hiring.
See the signals →Of 5,820 candidates screened, 3,359cleared the evidence gate — only 1,000 are published. Absence from the index is not absence of activity.
Read the methodology →What RPS measuresFive weighted signals. Discoverability and AI evidence carry 50%.Expand for detail ↓
Five public signals. One visibility score.
RPS (Raw Public Signal) is an outside-in benchmark of publicly observable AI, data, digital, and hiring signals. It measures public signal strength, not the full extent of private internal capability.
Whether search and AI systems can find and identify the organisation.
Public evidence of AI, data, analytics, automation, and digital activity.
Public references to cloud, SaaS, ERP, CRM, and platform maturity.
Recent third-party coverage: launches, partnerships, awards, news.
Public hiring and role signals for AI, data, analytics, and digital work.
The index
1,000 organisations, ranked by visibility.
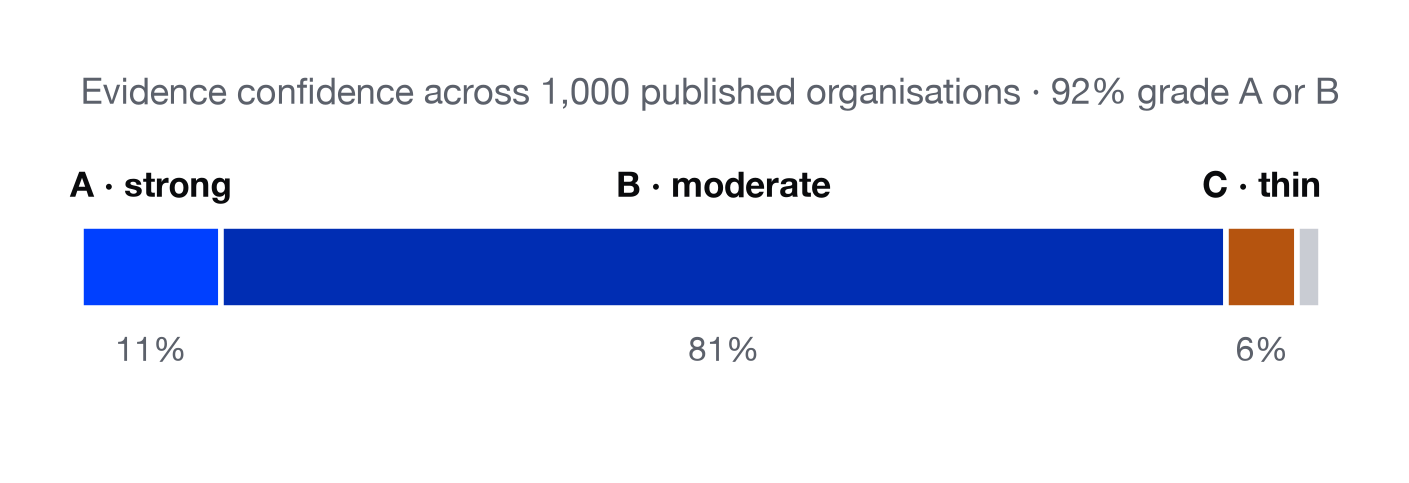
Filter by market, sector, visibility tier, evidence confidence, or classification. Defaults to the 1,000 published organisations, all of which cleared the evidence gate. Each row links to a full evidence profile.
| Rank | Company | Market | Sector | Tier | RPS | Evidence | Signal |
|---|---|---|---|---|---|---|---|
| 27 | Arbisoftarbisoft.com | Pakistan | Professional Services | Pacesetter | 70 | B | SupplierC |
| 36 | Systems Limitedsystemsltd.com | Pakistan | Tech/Fintech | Pacesetter | 70 | B | SupplierAdopterP |
| 45 | AB Ark Solutionsabark.tech | Pakistan | Tech/Fintech | Pacesetter | 68 | B | SupplierAdopterP |
| 70 | Folio3folio3.com | Pakistan | Professional Services | Pacesetter | 66 | B | SupplierC |
| 162 | BankIslami Pakistan Limitedbankislami.com.pk | Pakistan | Financial Services | Momentum | 62 | B | |
| 224 | Bravado Solutionsbravadosolutions.com | Pakistan | Professional Services | Momentum | 61 | B | SupplierC |
| 229 | Code Districtcodedistrict.com | Pakistan | Tech/Fintech | Momentum | 61 | B | SupplierAdopterP |
| 286 | Bazaar Technologiesbazaartech.com | Pakistan | Tech/Fintech | Momentum | 59 | B | SupplierAdopterP |
| 367 | Pakistan Telecommunication Company Limitedptcl.com.pk | Pakistan | Tech/Fintech | Momentum | 58 | B | SupplierAdopterP |
| 388 | Avanza Solutionsavanzasolutions.com | Pakistan | Tech/Fintech | Momentum | 57 | B | SupplierAdopterP |
| 393 | CodeNinjacodeninjaconsulting.com | Pakistan | Professional Services | Momentum | 57 | B | SupplierC |
| 405 | I2C Inc.i2cinc.com | Pakistan | Professional Services | Emerging | 57 | B | SupplierC |
| 507 | TPS Worldwidetpsworldwide.com | Pakistan | Tech/Fintech | Emerging | 56 | B | SupplierAdopterP |
| 585 | Packages Limitedpackages.com.pk | Pakistan | Manufacturing | Emerging | 54 | B | |
| 592 | Shispare Pvt. Ltd.shispare.com | Pakistan | Logistics/Supply Chain | Emerging | 54 | B | |
| 596 | Tezeracttezeract.ai | Pakistan | Logistics/Supply Chain | Emerging | 54 | B | |
| 635 | Confizconfiz.com | Pakistan | Professional Services | Emerging | 53 | B | SupplierC |
| 718 | TPL Mapstplmaps.com | Pakistan | Tech/Fintech | Emerging | 53 | B | SupplierAdopterP |
| 731 | Zongzong.com.pk | Pakistan | Professional Services | Emerging | 53 | B | SupplierC |
| 754 | InvoZoneinvozone.com | Pakistan | Logistics/Supply Chain | Emerging | 52 | B | |
| 767 | Telenor Pakistantelenor.com.pk | Pakistan | Professional Services | Emerging | 52 | B | SupplierC |
| 772 | 10XDS10xds.com | Pakistan | Professional Services | Emerging | 51 | B | SupplierC |
| 795 | Fauji Fertilizer Company Limitedffc.com.pk | Pakistan | Manufacturing | Emerging | 51 | B | |
| 805 | Meezan Bank Limitedmeezanbank.com | Pakistan | Financial Services | Emerging | 51 | B | |
| 816 | PanaceaLogicspanacealogics.com | Pakistan | Logistics/Supply Chain | Emerging | 51 | B | |
| 821 | PureLogicspurelogics.com | Pakistan | Tech/Fintech | Emerging | 51 | B | SupplierAdopterP |
| 852 | AKS iQaksiq.com | Pakistan | Professional Services | Emerging | 50 | B | SupplierC |
| 862 | Bank Alfalah Limitedbankalfalah.com | Pakistan | Financial Services | Emerging | 50 | B | |
| 952 | Techtrix Systemtechtrixsystem.com | Pakistan | Professional Services | Emerging | 50 | B | SupplierC |
| 953 | Telenor Microfinance Bank Limitedtelenorbank.pk | Pakistan | Financial Services | Emerging | 50 | B |
Depth check and sector patterns
What the sample can support.
By sector (mean RPS)
| Sector | n | Mean & 95% CI |
|---|---|---|
| Financial Services | 268 | 56.956.2–57.7 |
| Logistics/Supply Chain | 89 | 55.654.6–56.6 |
| Manufacturing | 137 | 56.255.2–57.2 |
| Professional Services | 205 | 57.456.6–58.3 |
| Retail/E-commerce | 92 | 55.654.6–56.6 |
| Tech/Fintech | 209 | 56.956.1–57.7 |
Sectors are listed alphabetically, not ranked. RPS is public-evidence visibility, not verified readiness.
Candidate sourcing depth correlates with the country prior, and all five scored signals also load positively on depth. AIR APAC therefore publishes company rankings and each market’s own disclosed context, but no comparison of market means. Read defects D6 and D7 in the methodology.
Limitations
What this measures, and what it does not.
- RPS measures public-evidence visibility, not verified internal readiness. Strategy intent that has not shipped, and budget that has not produced visible output, are not captured.
- Known bias: organisations that publish in English and publish frequently score higher. Local-language sources are not yet included.
- Sample construction: the universe is proxy-led, not a census. Absence from the index is not a finding of low activity.
Downloads
Take the data with you.
A sanitised public CSV with rank, RPS, adjusted RPS, visibility tier, evidence confidence, and classification for every published entity.
22 of the 23 covered markets also publish a full PDF dossier: market readiness context, tier composition, and the top public-signal organisations for that market.